Author: Zhu Yulong
Based on the terminal insurance data for the Chinese automobile market (passenger cars) in week cycles and while waiting for detailed data to be released later, I am compiling an early version of the report for 2022.
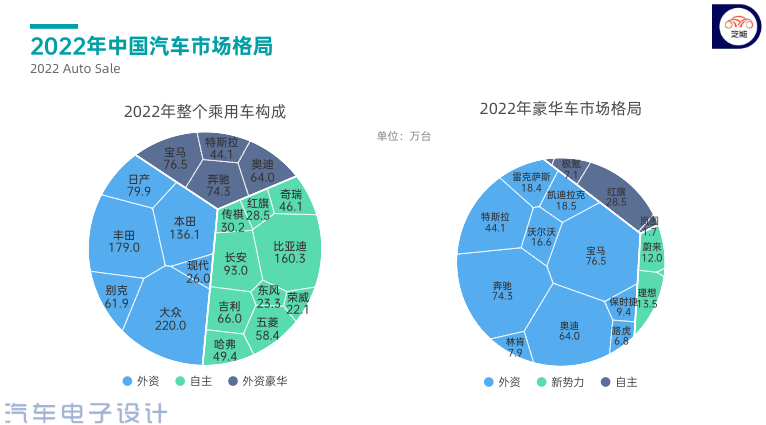
In terms of brand ranking, Volkswagen is in first place (2.2 million), Toyota is in second place (1.79 million), BYD is in third place (1.603 million), Honda is in fourth place (1.36 million), and Changan is in fifth place (0.93 million). In terms of growth rate, Volkswagen has slightly declined, while Toyota has grown marginally, and BYD has increased by 123% due to the lifting of historic limitations on its fuel-powered vehicles.
The Matthew effect in the automobile market is a reality, as it becomes increasingly hard for smaller automobile companies to survive. In 2022, the sales volume of terminal passenger cars is 5.23 million, which accounts for a total market of 20.21 million new cars, with a penetration rate of approximately 25.88%. Assuming that the demand for the entire market does not increase very quickly in the next three years, the penetration rate is expected to further rise. However, there are also serious challenges to slowing down the speed of growth.

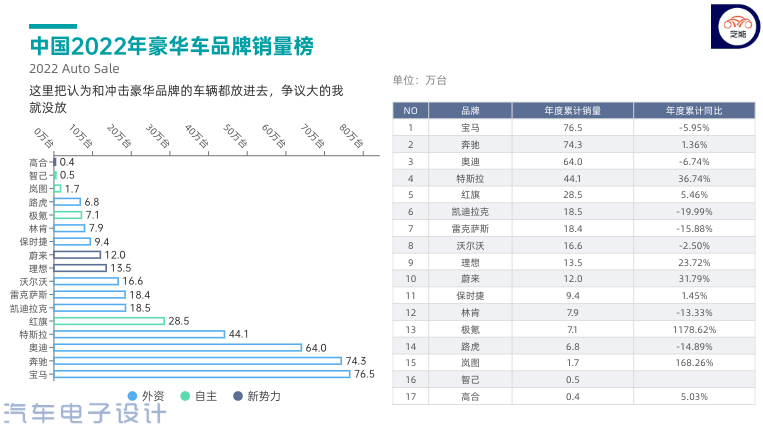
For automobile companies, the shift to new energy vehicles and the stock paradigm is critical. It is essential to migrate from fuel-powered vehicles to new energy vehicles and from the mid-to-low end to more attractive competition lanes. For foreign companies, looking at the top 20 luxury brands, only a few brands with strong competitiveness, Volkswagen, Toyota, Honda, Nissan, and Buick, will survive in the next few years.
When we look at the top 20 brands that fall below the 200,000 mark, the concentration of the entire brand will become increasingly high in the coming years, assuming that the domestic terminal new car demand of about 20 million remains unchanged for the next three years.
Reflection on the development of automobile brands
The more we reflect on the automobile market, the more we realize that companies rely on technology to establish their own product mix, and eventually obtain market share and pricing power. In this process, the most fundamental key is either to follow the path of scale or the route of brand premium. Some companies depend on vehicles that cost more than 300,000 RMB to make money, while others rely on scale to earn profits in the 100,000 to 200,000 RMB range; The logic and approach for different brands are entirely different.
BMW costs 765,000 yuan, Mercedes-Benz costs 743,000 yuan, and Audi costs 640,000 yuan. These three brands are particularly stable. Next comes Tesla which costs 441,000 yuan. In order to maintain their profitability and market share against BBA, this is the choice that Tesla needs to make in China. Next are cars in the 100,000-200,000 yuan range, including Cadillac, Lexus, Volvo, Ideal, and NIO, with Porsche having a fast-growing market of nearly 100,000 yuan.
Of course, luxury cars with high prices need to have a technical foundation and brand support, which requires long-term accumulation and is a matter of course.
Looking at the logic of new energy vehicles, whether a company captures this opportunity or misses it has a completely different impact on its development. Interestingly, the last of the TOP20 is Roewe. The concentration of new energy vehicles is higher than we think. The key issue is that it is more difficult to make money.
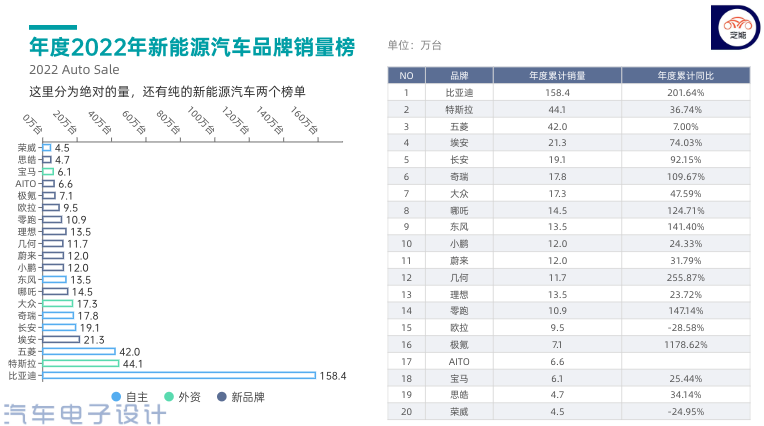
In the entire new energy vehicle market of 5.23 million, BYD’s market share reached 30%, which is much higher than the 10.8% market share of Volkswagen in the entire passenger car market.
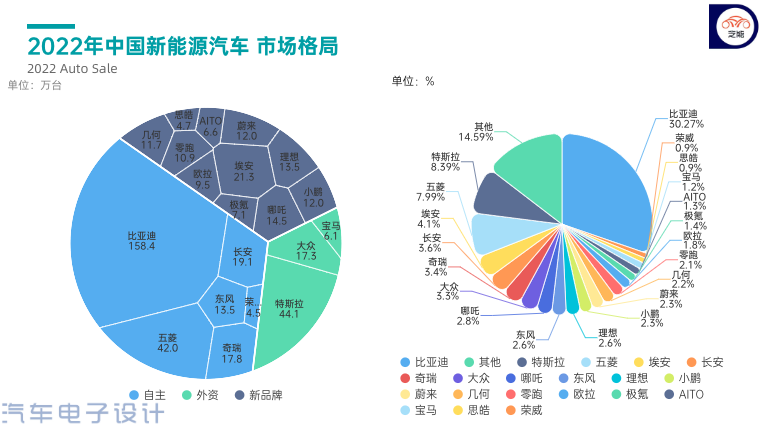
I think that whether it is pure electric or extended range vehicles, it is seizing the opportunity — when oil prices rise, and coupled with the verification of product reliability in recent years, consumer habits change quickly. Opportunities are always left to those who are prepared.
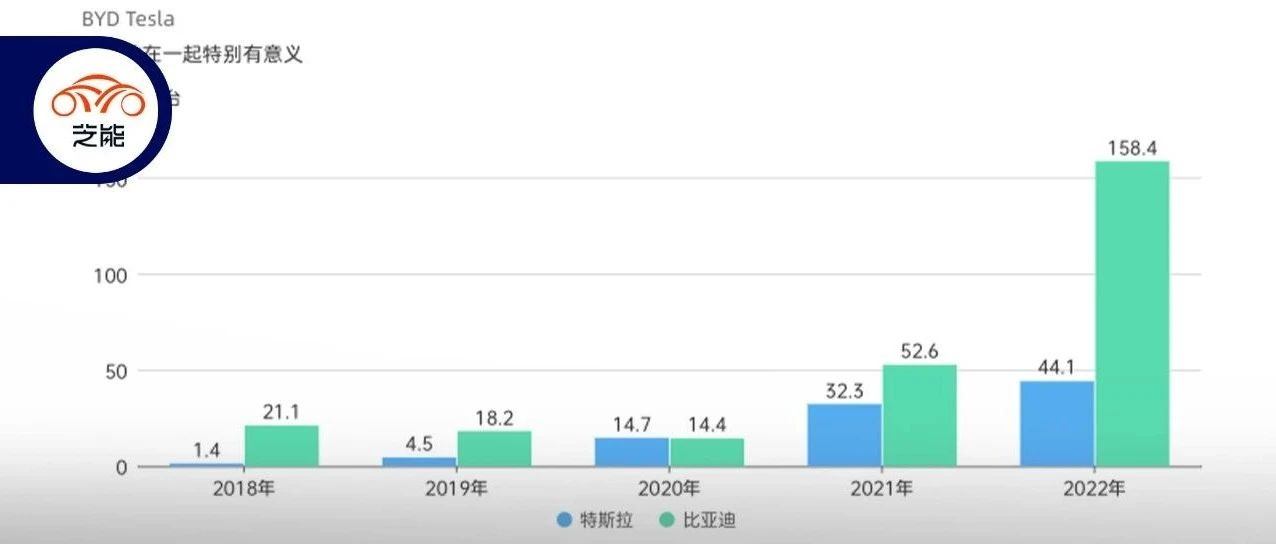
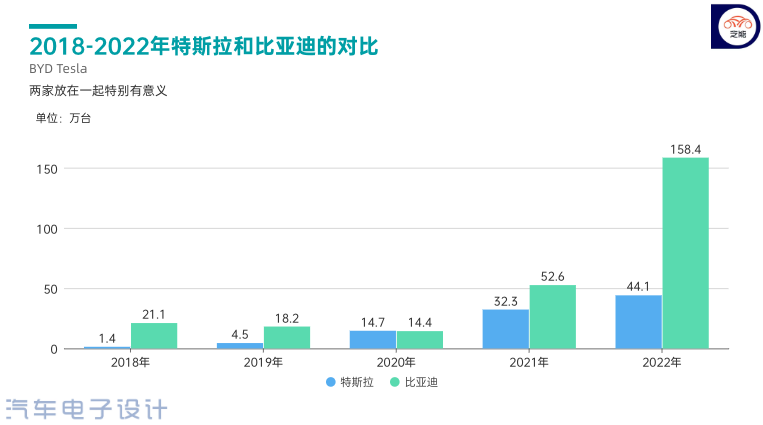
 ## Tesla and BYD
Looking at Tesla’s data, the rapid decline in December was unexpected. The momentum of Model Y, influenced by both price reductions and earlier orders, led us to observe that consumers are making more rational choices regarding Tesla. They are starting to move away from buying Tesla in a frenzy to more gradual purchasing.
Note: Early this morning, we received news of Tesla’s across-the-board price reduction. Tesla’s response to market data was indeed very prompt.
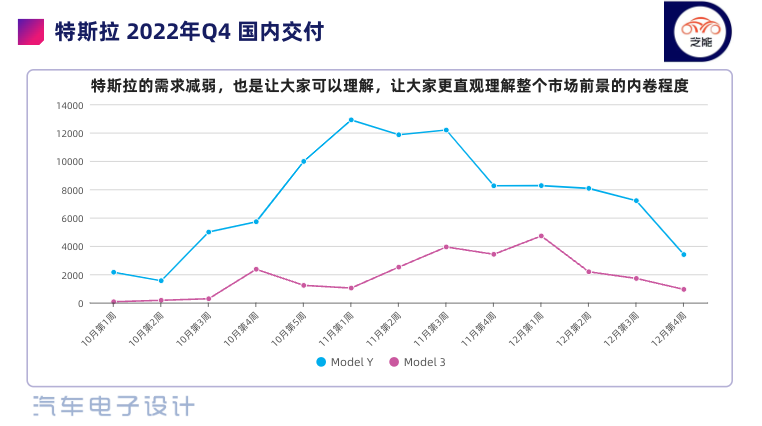
When looking at the overall data with this flow chart, it becomes clear that, when taking demand for exports off the table, Tesla’s situation in Q4 has indeed caused us to be more rational about the prospects for 2023.
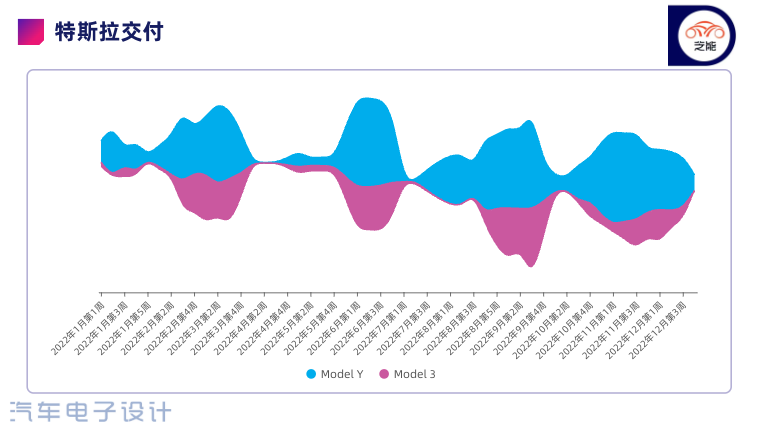
I will take the time to produce a video to consider and discuss the changes in the market environment between Tesla and BYD. In my opinion, the biggest difference between the two is the difference in their product matrices.
If we say that in 2021, Tesla’s pure electric vehicle was pushed forward by various advantages, while BYD’s strategy in 2022 is to lower the prices of its pure electric vehicle main force and snatch market share away from gasoline vehicles through the DM-i series. It is Tesla’s misjudgment to rely on Model 3 and Model Y to compete with gasoline vehicles in the current high price range. We will discuss this topic in detail.
Conclusion: This is a preview. Recently, we have been working hard to consider the changes in the development of the Chinese automobile market from 2023 to 2025. What factors will affect the trend, and what changes will take place in the market landscape. It will require a lot of effort to figure it all out.# 标题
这是一个段落,其中包含 加粗的文本 和 斜体文本,还有一个链接和一个图片:

列表
有序列表
- 第一项
- 第二项
- 第三项
无序列表
- 项目1
- 项目2
- 项目3
代码
这是一段代码:print("Hello, world!"),下面是一段代码块:
def say_hello():
    print("Hello, world!")

say_hello()
引用
这是一段引用文本。
表格
| 列1 | 列2 |
|---|---|
| 行1列1 | 行1列2 |
| 行2列1 | 行2列2 |
Translation
This is a paragraph containing bold text and italic text, as well as a link and an image:
Lists
Ordered List
- First Item
- Second Item
- Third Item
Unordered List
- Item 1
- Item 2
- Item 3
Code
This is some code: print("Hello, world!"), and below is a code block:
def say_hello():
    print("Hello, world!")

say_hello()
Quote
This is a quoted text.
Tables
| Column 1 | Column 2 |
|---|---|
| Row 1 Column 1 | Row 1 Column 2 |
| Row 2 Column 1 | Row 2 Column 2 |
This article is a translation by ChatGPT of a Chinese report from 42HOW. If you have any questions about it, please email bd@42how.com.