Author: Zhu Yulong
I am planning a visualization topic on new energy vehicles, which will use various charts and interpretations (with short videos to be added later) every month to facilitate readers to quickly grasp all aspects of the new energy vehicle industry.
In May 2022, the total sales volume of new energy passenger vehicles was 325,000, up 81.5% YoY and 23.3% MoM. The sales volume of pure electric passenger vehicles was 243,000, and the sales volume of plug-in hybrid (including extended range) was 82,000. The penetration rate of new energy was 24.6%, a slight decrease from the previous month.
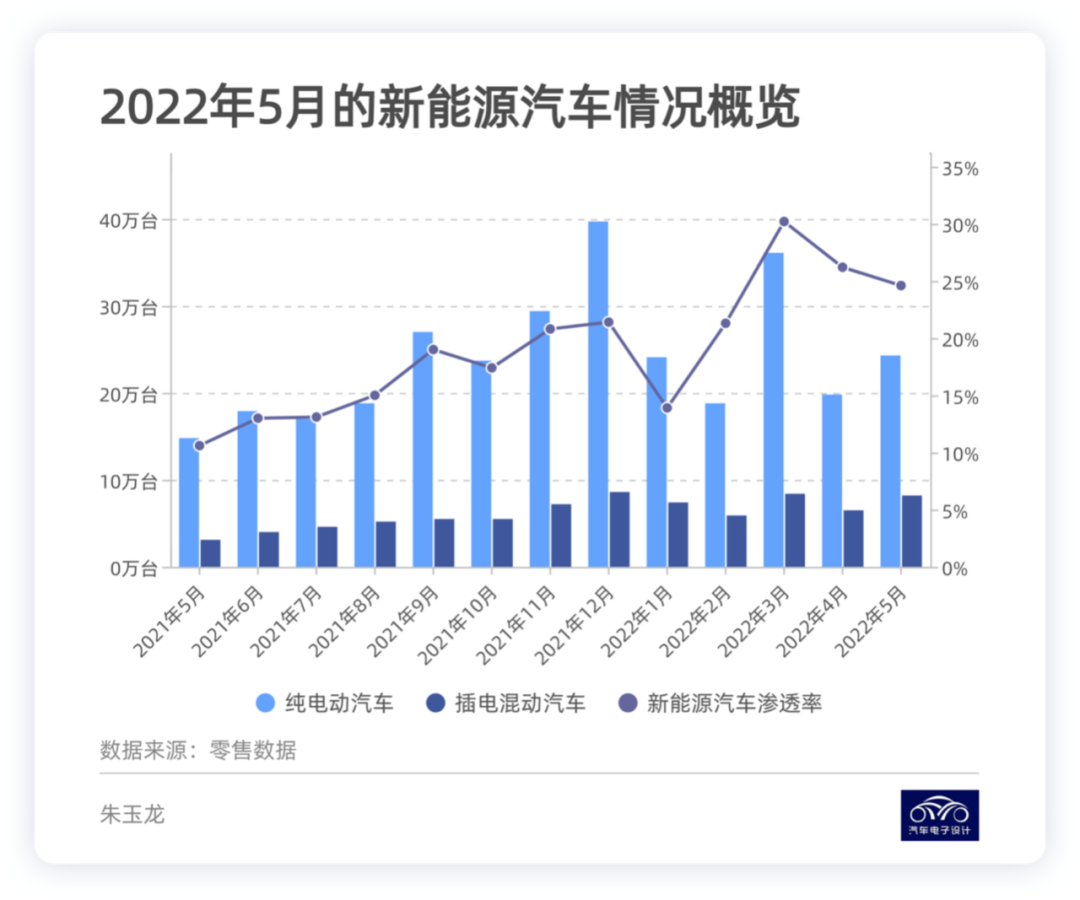
In this issue, I primarily want to answer the following questions:
- Where are new energy vehicles being sold?
- What is the range of endurance that people are selecting when choosing new energy vehicles?
Overview of New Energy Vehicle Sales
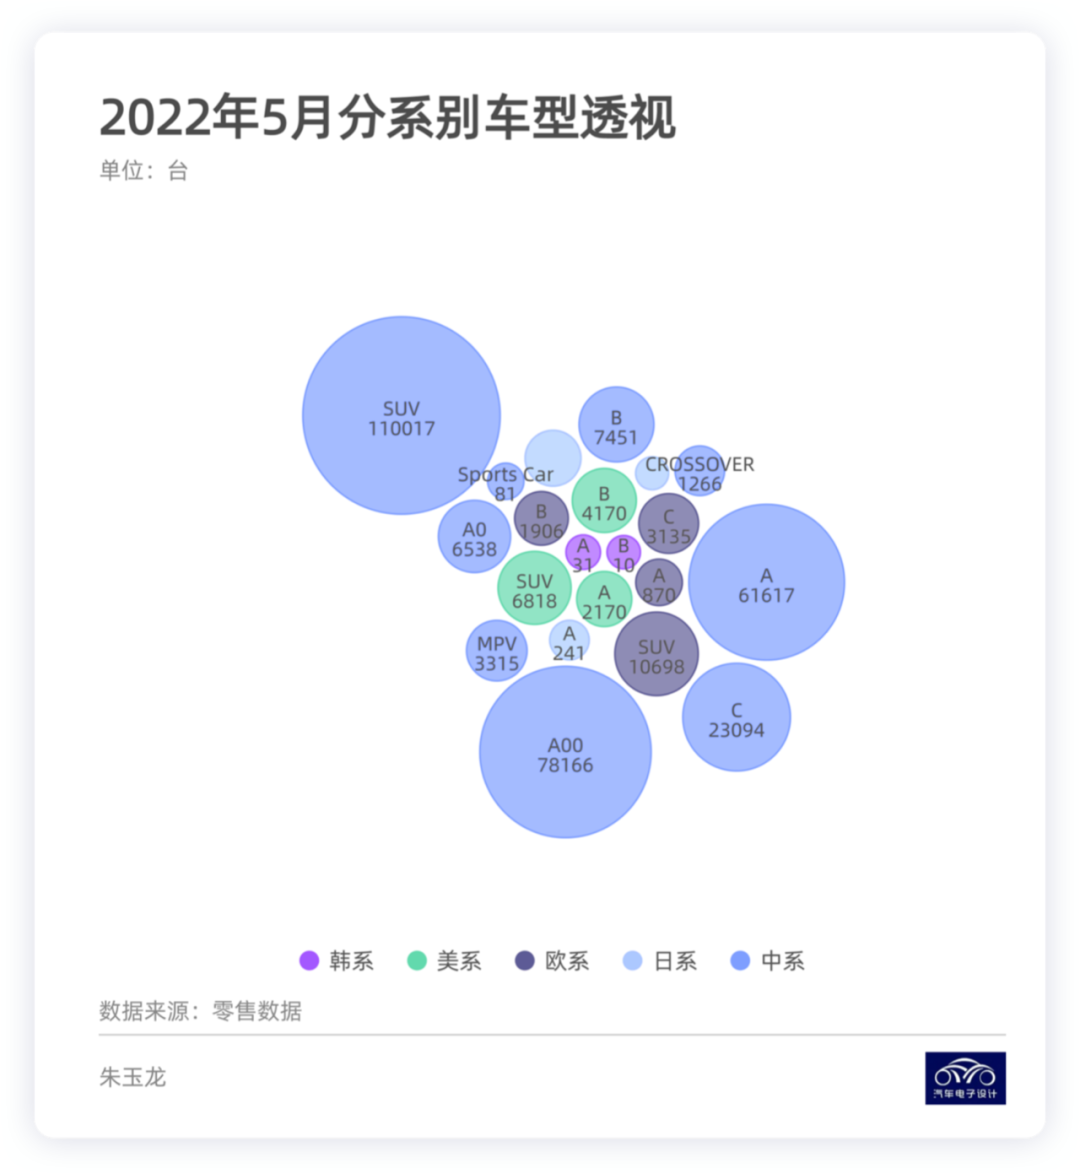
The growth of new energy vehicles this time exceeded our expectations. Of the 325,000 new energy vehicles, domestic brands in China accounted for 290,150, or 90%. American and European brands accounted for approximately 4-5% each. In the category of new energy SUVs, Chinese domestic brands accounted for 110,000, followed by A00 class small cars at 78,000, while A-class vehicles were last at 61,600. This means that the situation where A00 class + large cars on both ends dominated in 2021 has been broken.
As more fuel-purchasing cars choose new energy vehicles due to high gasoline prices, the first change is in SUVs that used to consume oil. This is the transformation brought about by high fuel prices in 2022.
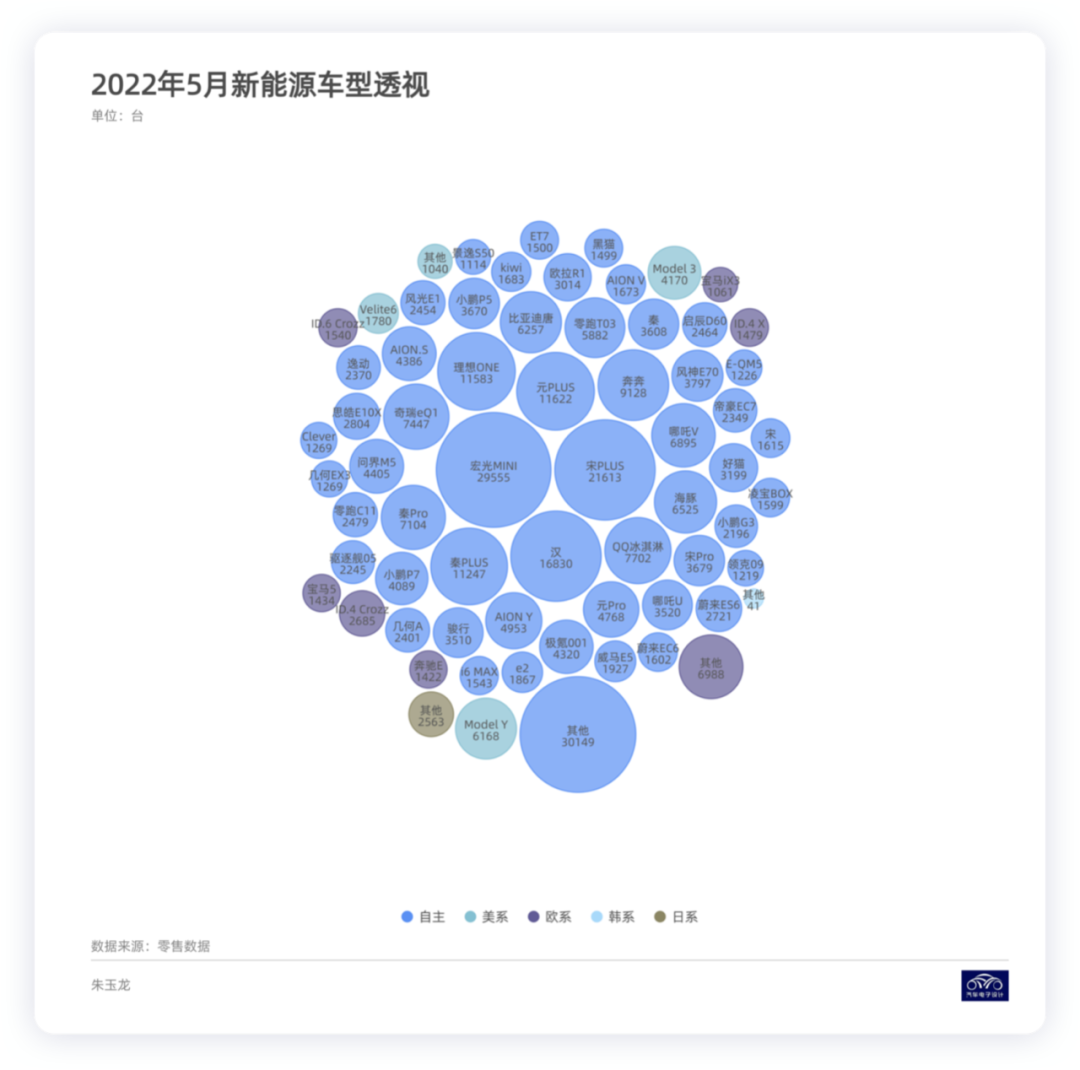
In terms of specific model series, we see that the top-selling series is the Wuling Hongguang Mini, followed by the Song Plus series, and the third is the Han series. The following picture shows the models that consumers are choosing more clearly.
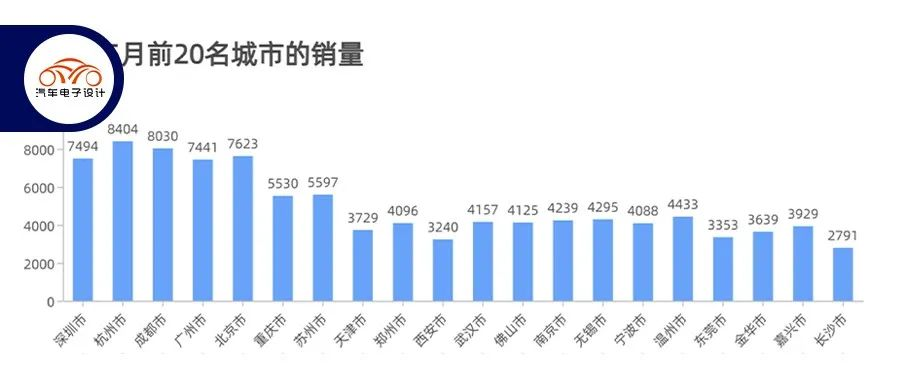
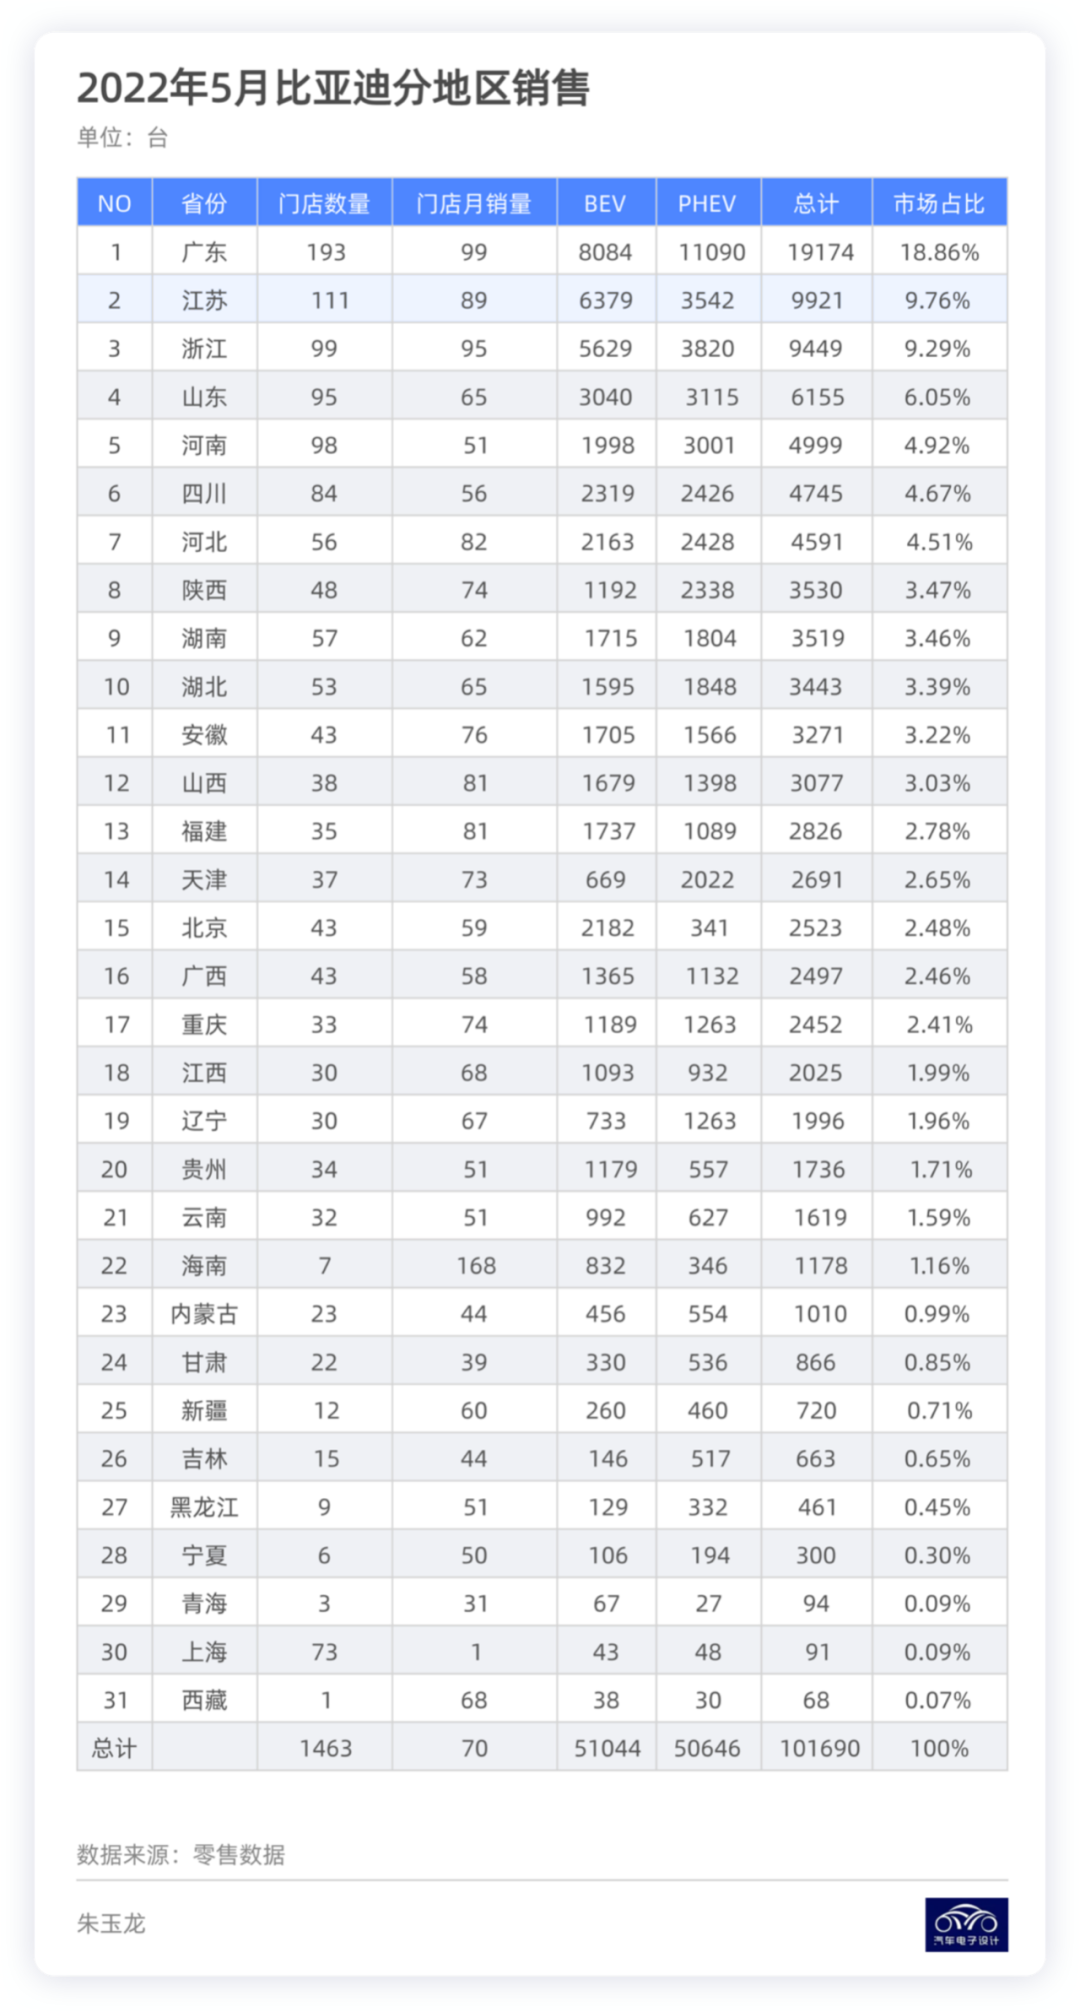
Guangdong, Zhejiang, and Jiangsu ranked among the top sales provinces in May, while consumption in Shanghai was suppressed due to the epidemic. In May, we saw that non-restricted cities and provinces expanded relatively quickly, and pure electric vehicles also achieved high sales in many provinces.
In May, there were 4 cities that sold more than 10,000 new energy vehicles, which are Shenzhen, Hangzhou, Chengdu, and Guangzhou (Shanghai is estimated to start increasing in June). Plug-in hybrids are gradually getting rid of the license plate restrictions in some cities; however, the sales volume of pure electric vehicles in Beijing, Shenzhen, Hangzhou, Chengdu, and Guangzhou still surpasses other cities. It actually indicates that electric vehicles are becoming more widely accepted and used.
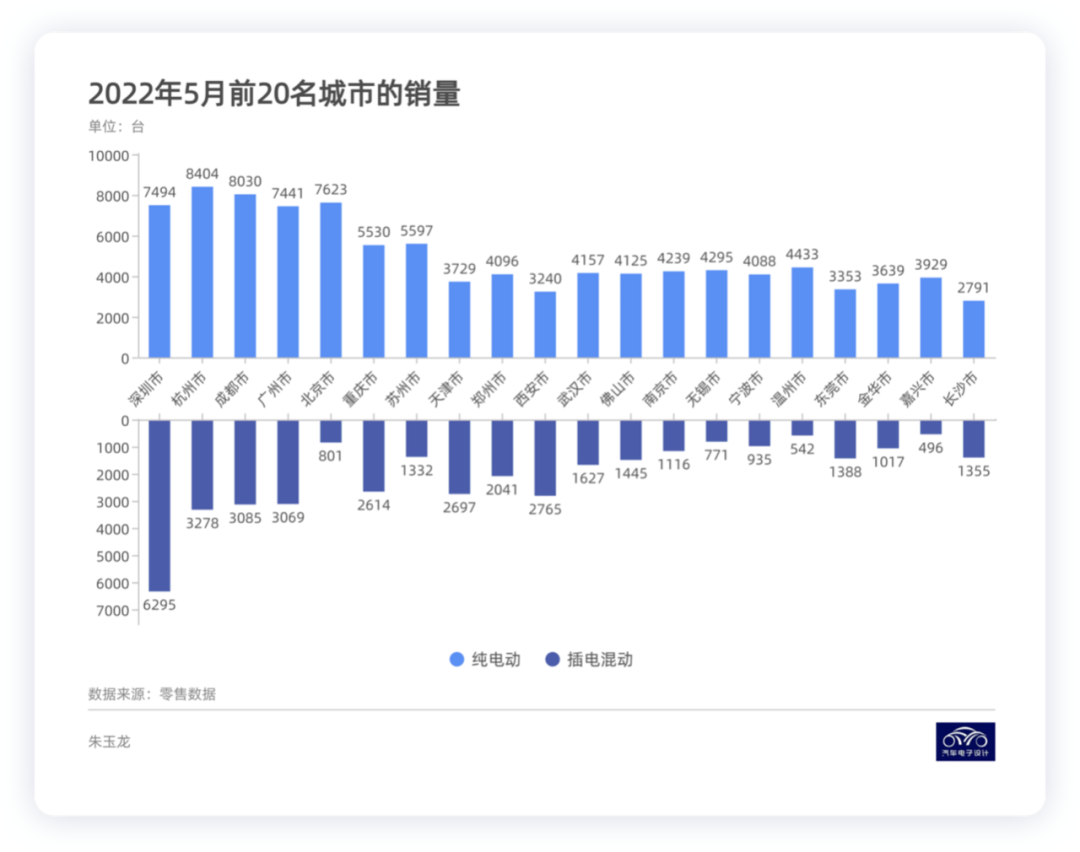
Here, we can compare the situation of BYD. I have selected the distribution situation of the whole country. BYD is a typical example of overall sales network, and the effect is better.
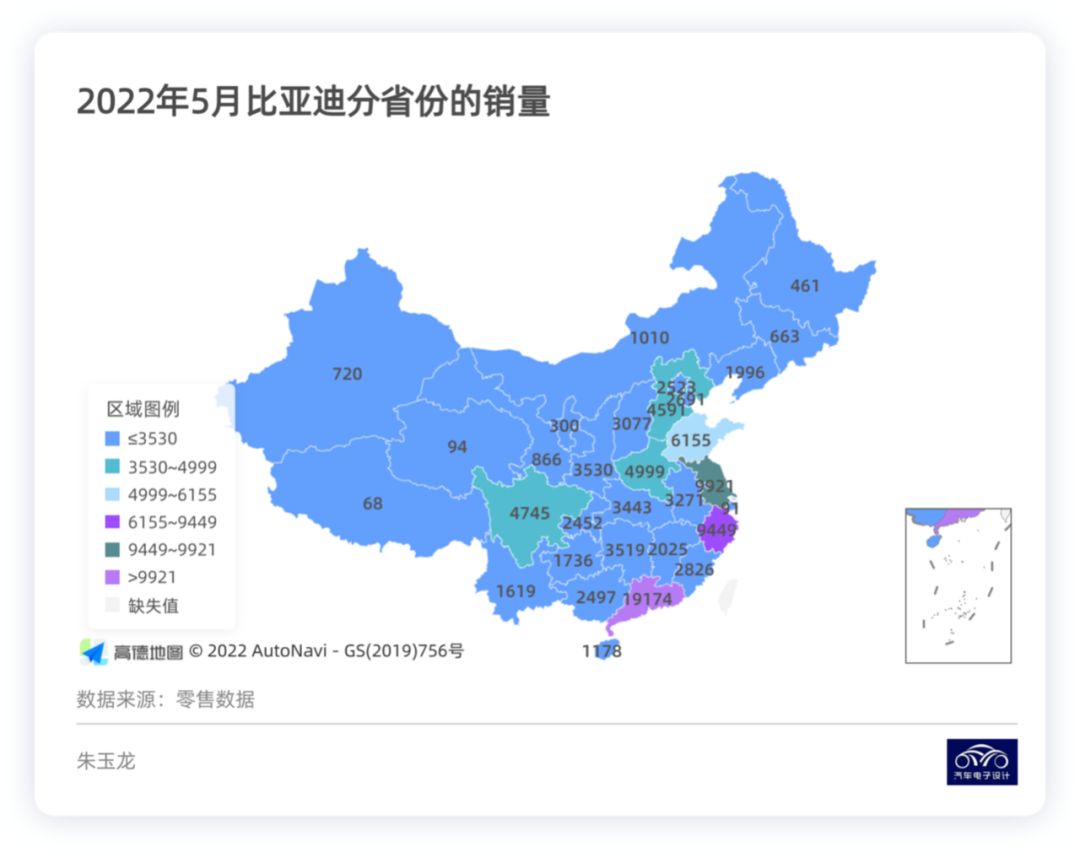
As of the beginning of May, there were nearly 1500 electric vehicle stores in China. BYD has replaced its original E网 with a more dynamic and distinctive Haiyangwang, and continues to expand its dealer channels. The number of dealers has reached 1463, including 549 stores for Haiyangwang and 914 stores for Wangchao. The absolute quantity and proportion of new first-tier and fourth-tier cities are the highest. BYD has strong penetration ability in non-gui-district areas. I think that analyzing regional data, the number of stores, and the preference of PHEVs and BEVs can better explain why BYD can sell so many cars.
Other Overviews
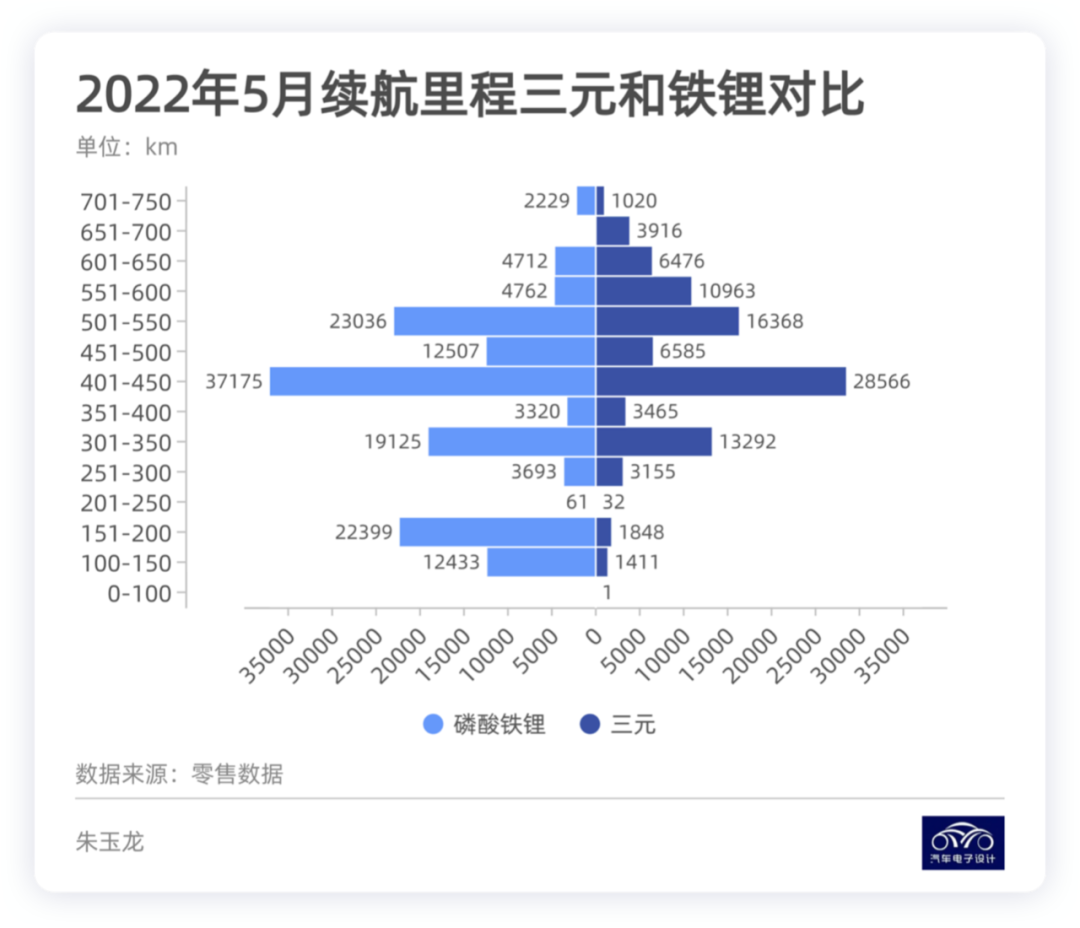
In terms of driving range, we see the following trend: with the increase of energy density, the driving range of China’s plug-in hybrids and pure electric vehicles is rapidly improving. As shown in Figure 6 below, cars with a driving range of 400-500 kilometers accounted for 82,800 units, while cars with a driving range of 500-600 kilometers accounted for 55,200 units.
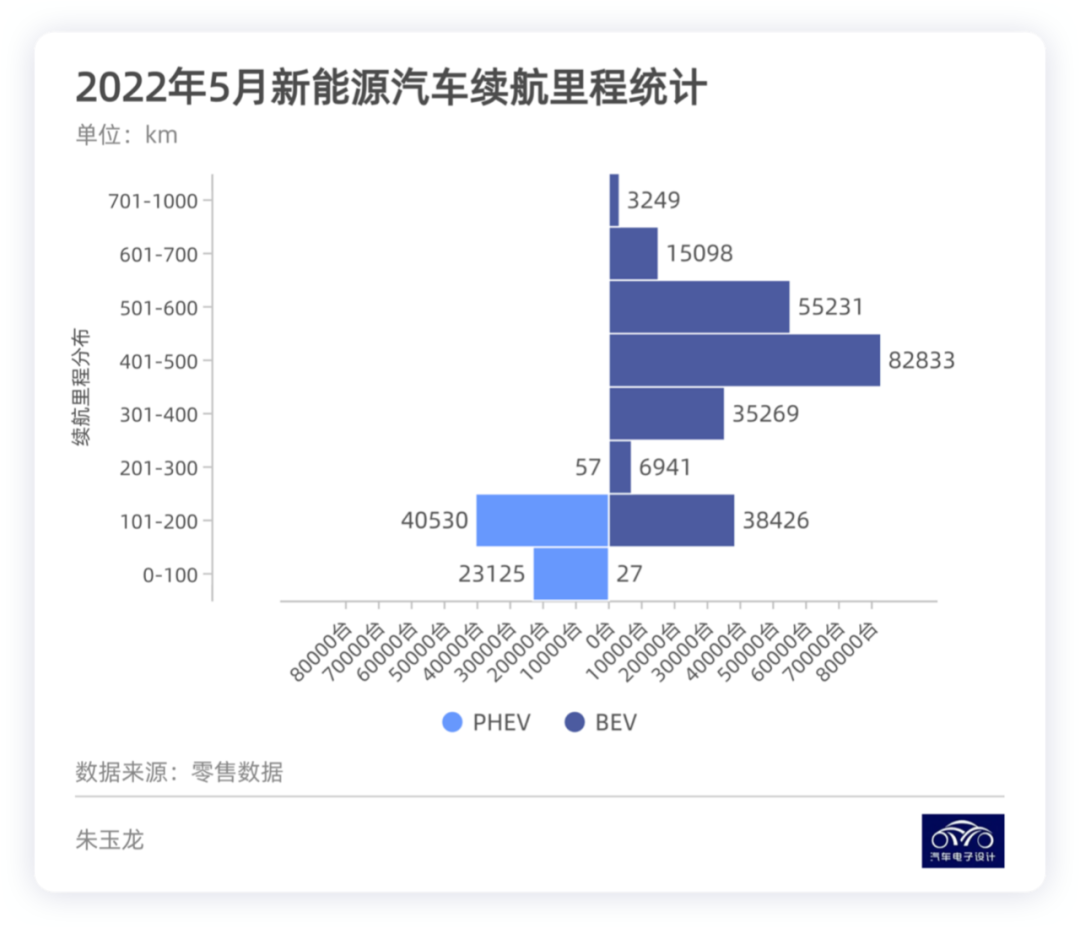 From the perspective of batteries, lithium iron phosphate batteries can also provide a range of more than 700 kilometers, while within the range of 400-550 kilometers, the amount of lithium iron phosphate solutions is more than that of ternary solutions, and this substitution is very obvious. Within 350 kilometers, lithium iron phosphate still accounts for the majority, which is a difference in choice among different car manufacturers.
Summary: I hope this series of graphical explanations will be helpful to everyone. I will continue to refine these perspectives to explore the changes in new energy vehicles every month.
This article is a translation by ChatGPT of a Chinese report from 42HOW. If you have any questions about it, please email bd@42how.com.
