In December, the on-insurance data for new energy vehicles reached a record-breaking 483,700 units (penetration rate of 21.29%), including 397,200 pure electric vehicles (penetration rate of 17.48%) and 86,500 PHEVs (penetration rate of 3.8%). Among pure electric vehicles, new forces (including Tesla) accounted for 124,100 units, while traditional automakers’ new energy vehicle on-insurance data totaled 121,400 units.
Let’s take a look at where the two important companies, Tesla and BYD, sold their new energy vehicles overall.
Where did Tesla sell its 70,000 cars in December?
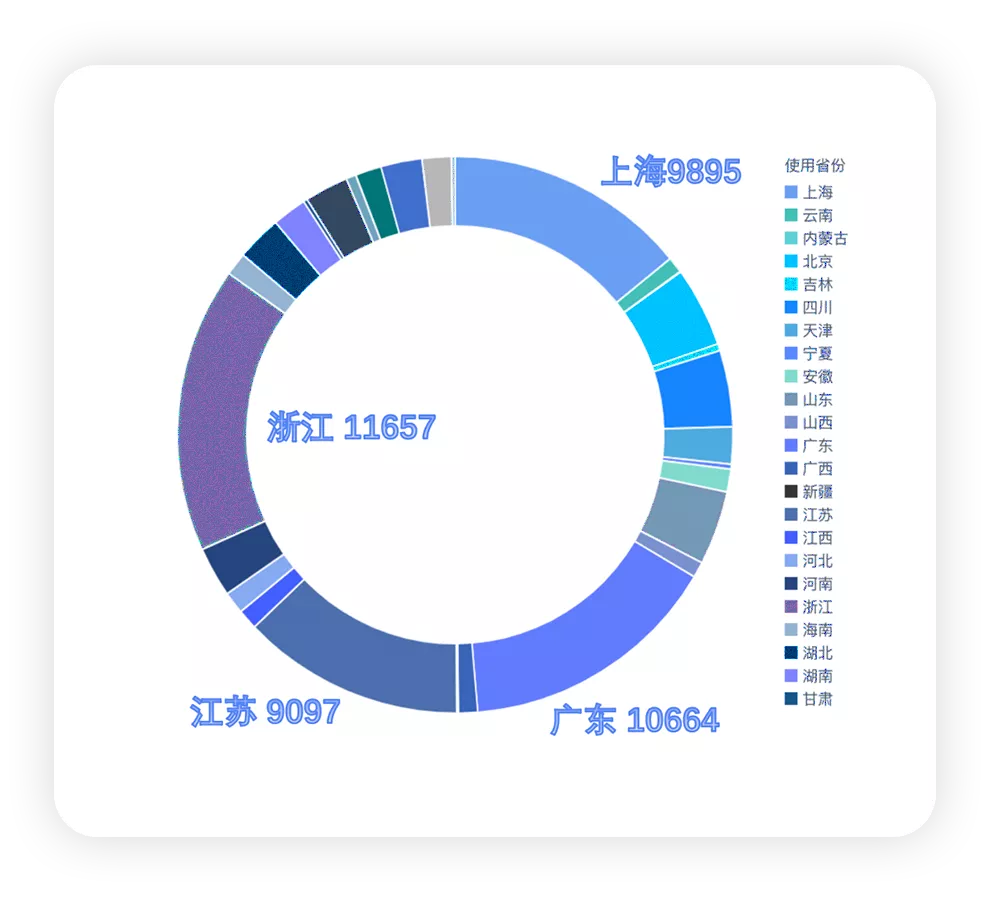
Looking at the provinces, Tesla’s main four destinations were Zhejiang with 11,657 units, Guangdong with 10,664 units, Shanghai with 9,895 units, and Jiangsu with 9,097 units, accounting for approximately 58.8%. As shown in Figure 1 below.
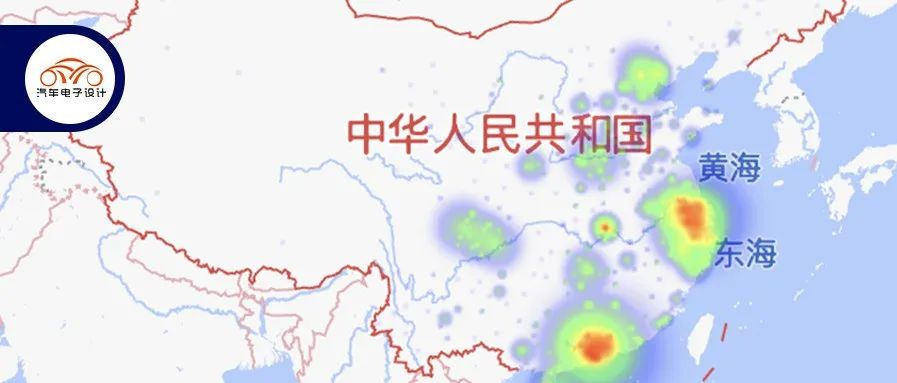
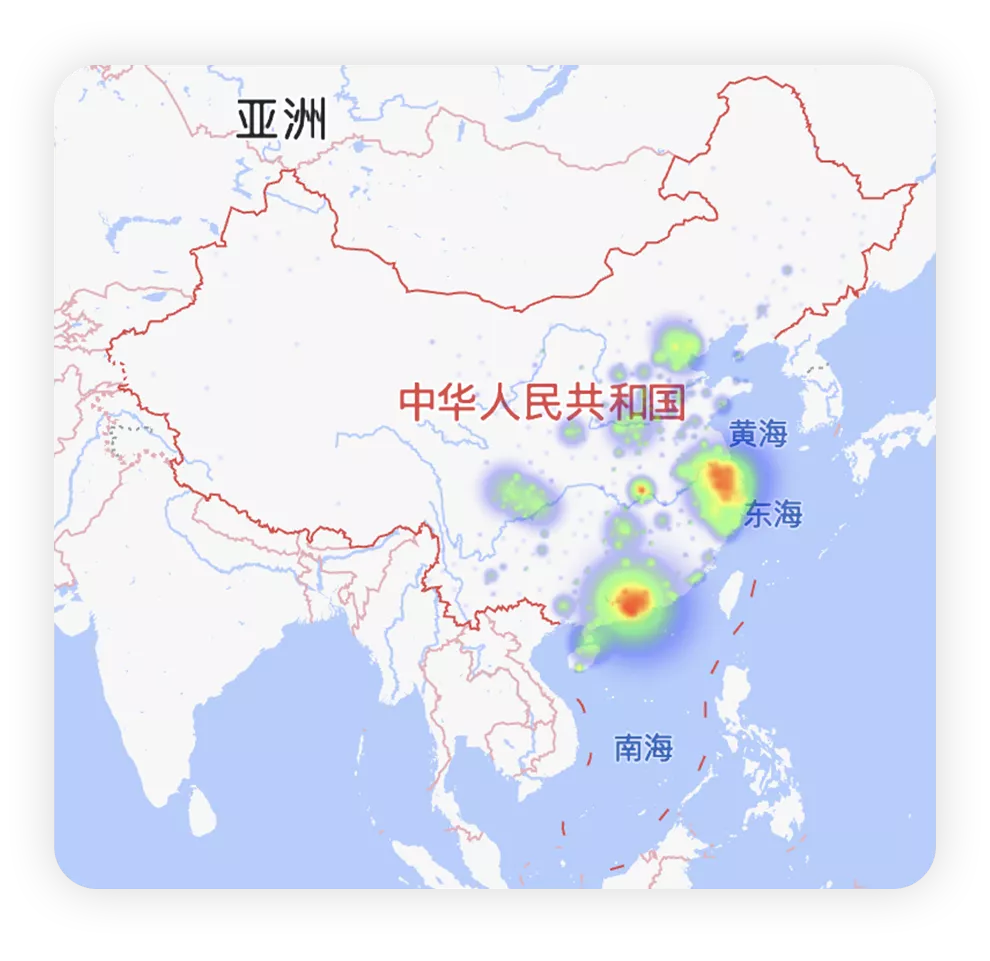
Breaking down the data by city, we can see that Tesla’s vehicles were mainly concentrated in the Yangtze River Delta, followed by the Pearl River Delta, then Beijing-Tianjin, followed by Chongqing and Chengdu – all driven by demand in these cities. As shown in Figure 2 below.
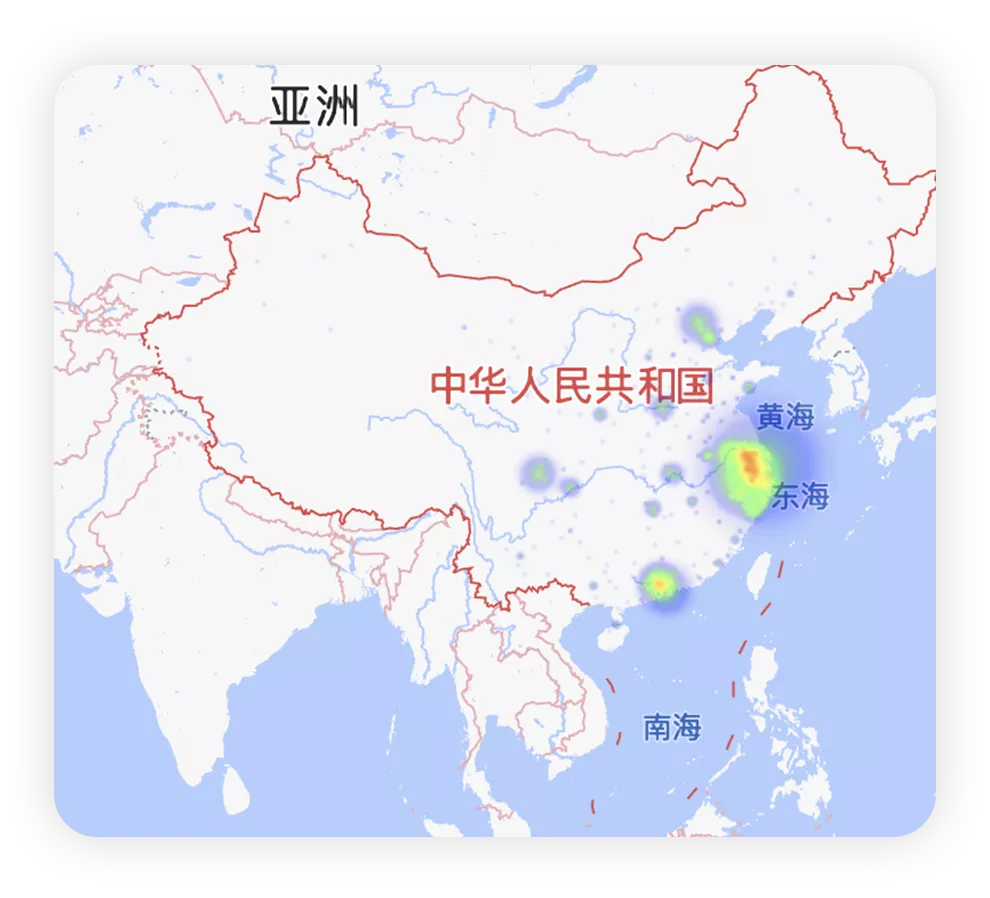
Tesla’s sales in December reached a new high.
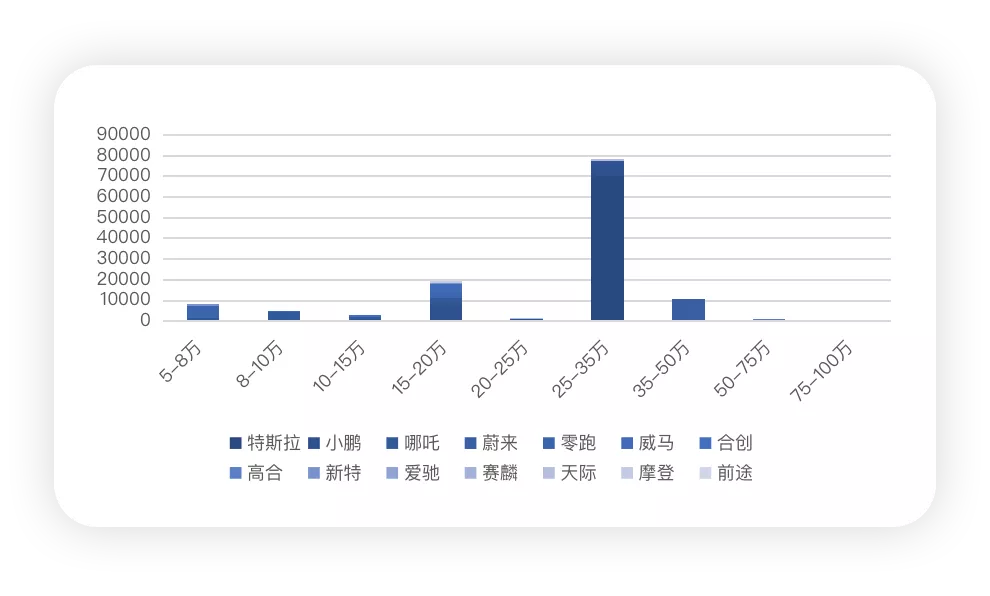
If we divide all new carmakers by price range, we get the chart shown in Figure 3 below. This price system can only be built mainly around economically active wealthy areas.
Where did BYD sell its over 90,000 vehicles?
I’m actually very curious about where BYD’s cars were sold. Top of the list is still Guangdong, where BYD sold 18,600 units, followed by Jiangsu, Zhejiang, Henan, and Shandong, ranging from 7,000 to 9,000 units.
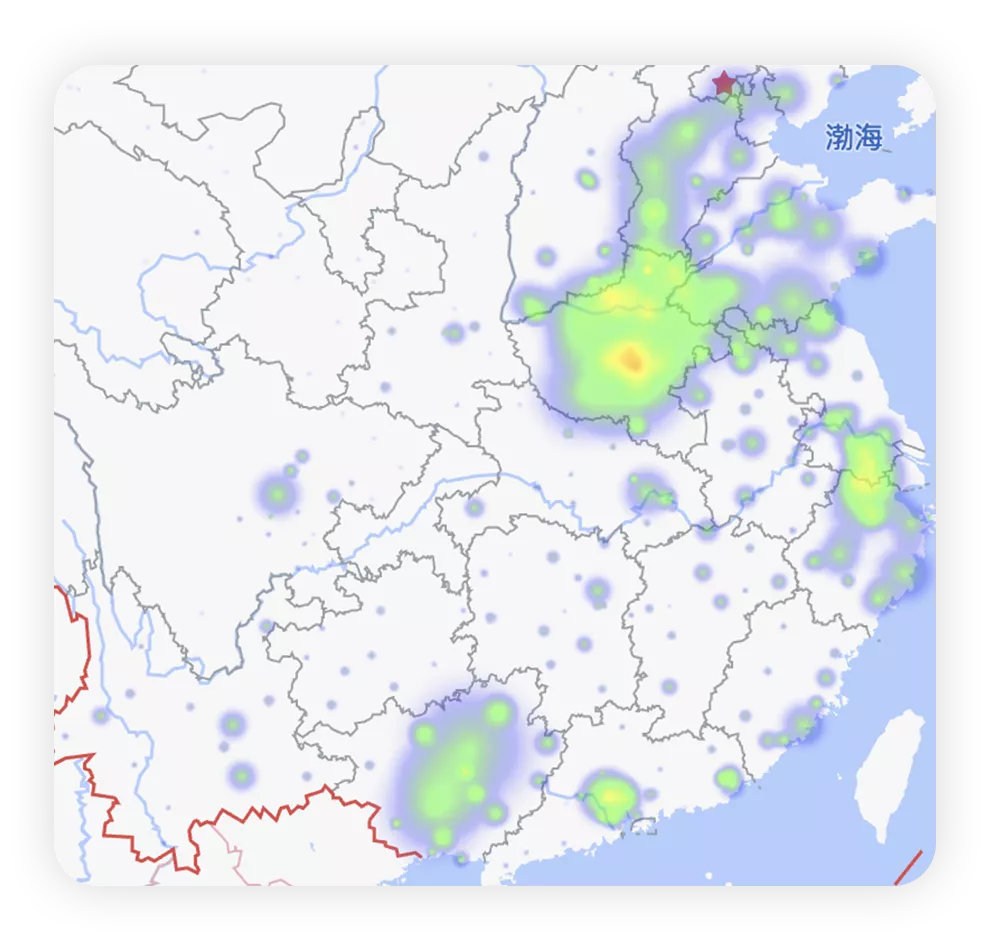
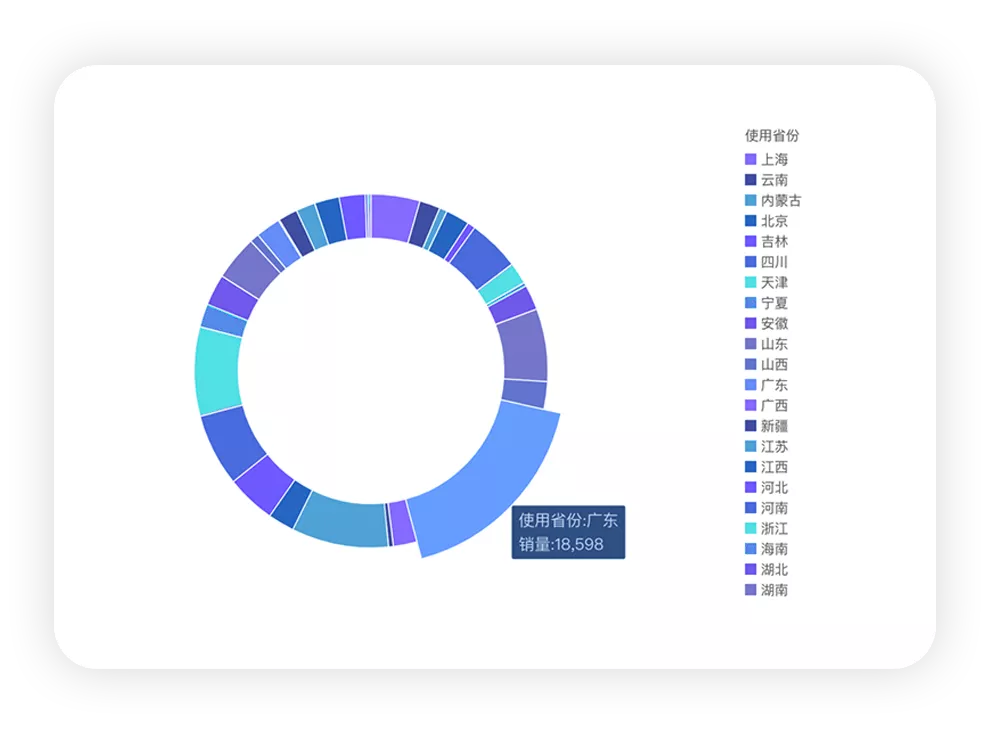 Compared with Tesla, BYD has a more distributed market. The heatmap below was generated by data analysis software and shows that BYD has a more widespread presence in the Pearl River Delta, Yangtze River Delta, Beijing-Tianjin-Hebei region, and central and western China.
In fact, it would be more meaningful to divide the discussion into two dimensions: BEV and PHEV.
As shown in Figure 6 below, this is the distribution of traditional automotive companies’ BEV models. We can see that the business models currently revolve around the price ranges of 150,000-200,000 and below 50,000. BYD’s pure electric vehicles start at a price range of 80,000-100,000 and cover up to 250,000-350,000 (Han BEV).
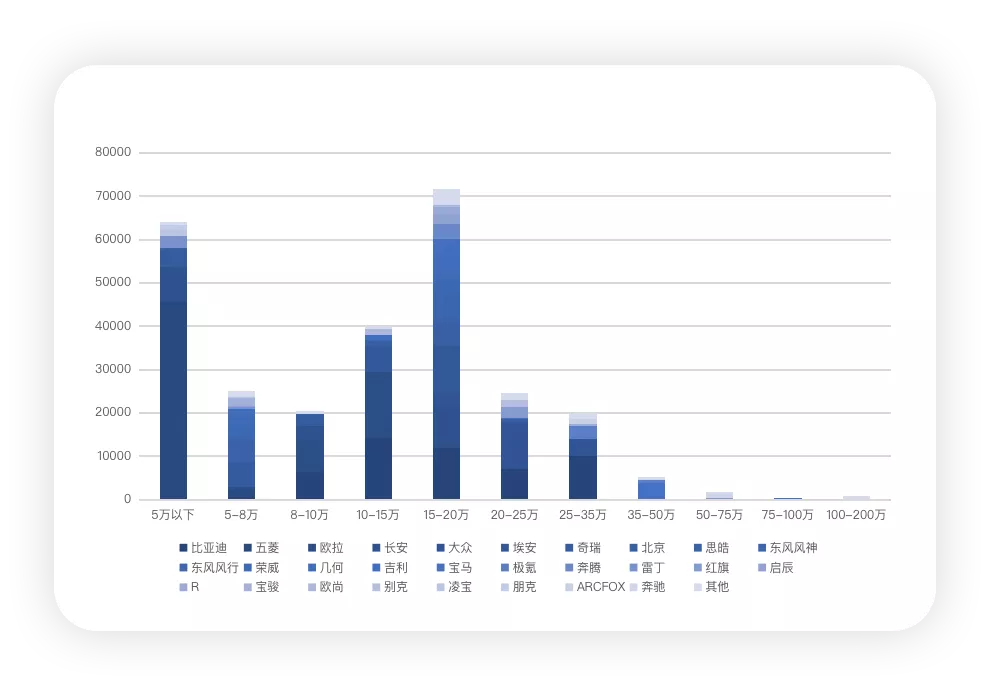
In my personal opinion, the strong penetration of BYD in this market is mainly due to the plug-in hybrid models in the 100,000-150,000 and 150,000-200,000 price ranges. This strategy can break through the areas that pure electric vehicles cannot cover.
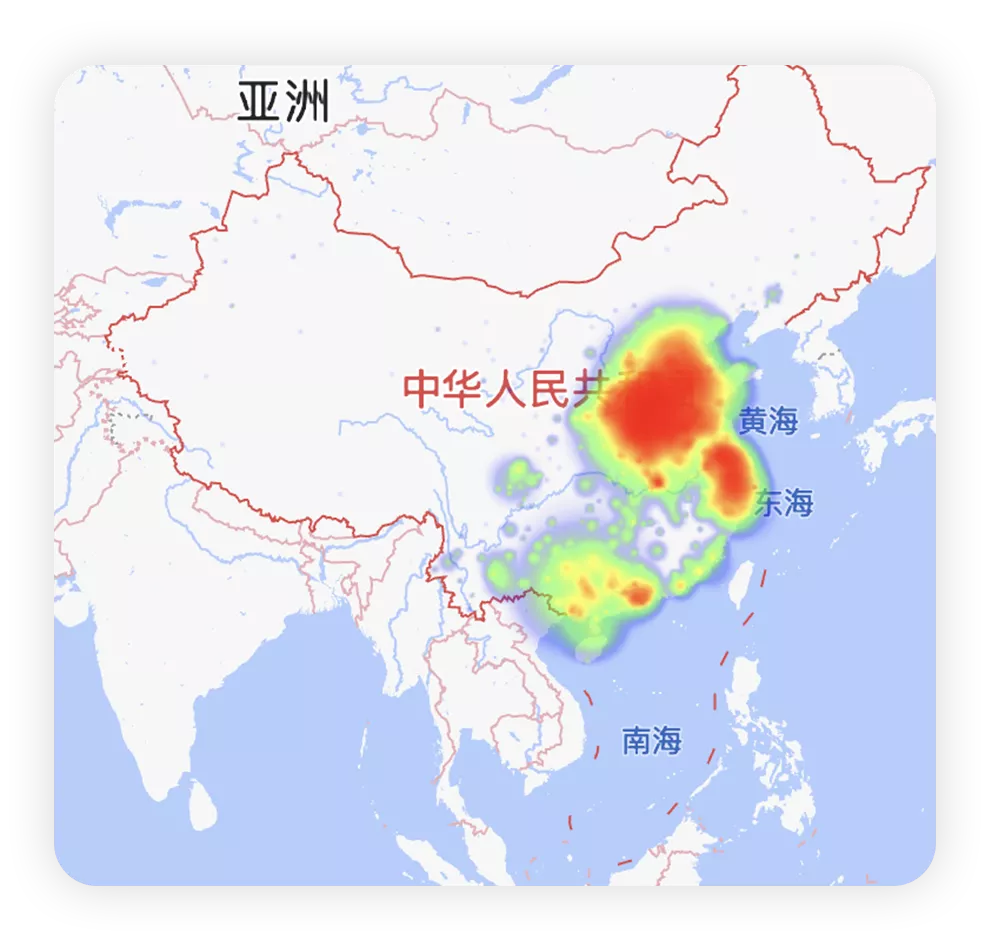
Of course, the coverage area of pure electric vehicles is currently limited, with Wuling’s distribution area being the farthest. I feel that the heatmap of insurance coverage data from Wuling essentially covers the prospective market areas of electric vehicles.
In conclusion, the data of insurance coverage in December has given me a lot of shock. With almost 500,000 vehicles insured in a single month, it has undoubtedly reached an unprecedented peak. This number has truly completed the task several years ahead of schedule.My understanding is that if the 30% reduction in subsidies from 2021 to 2022 results in a momentum of roughly 200,000, then the absence of subsidies from 2022 to 2023 will bring about a new wave of momentum. Therefore, it is highly likely that the sales volume in 2022 will follow a pattern of decreasing at first and then increasing.
This article is a translation by ChatGPT of a Chinese report from 42HOW. If you have any questions about it, please email bd@42how.com.
