
Author: Winslow
Here, the operational status, financial report, and major external events of Tesla are combined to reconstruct the process of Tesla’s market value growing from 30 billion to 1 trillion USD.
As we all know, Tesla was once on the brink of bankruptcy, which Elon Musk confirmed multiple times on social media, and often recalls the painful time during interviews. This “impending bankruptcy” period was roughly from 2016 to 2018.
However, as can be seen from the following chart, Tesla’s assets during this time period exceeded its liabilities, and the asset-liability ratio even improved significantly compared to the previous few years. It seems that bankruptcy was even further away, why did they say it was about to go bankrupt?
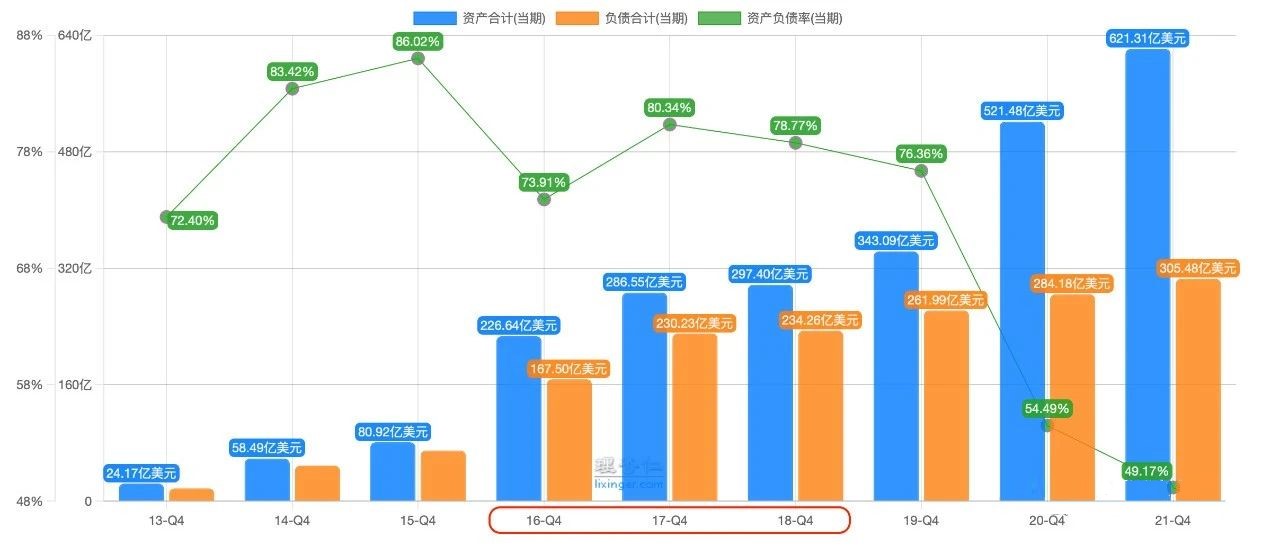
The “impending bankruptcy” mentioned by Elon Musk refers to a sub-item in the balance sheet: current assets and liabilities, which is often used to see whether a company has sufficient liquidity to pay its debts in the short term.
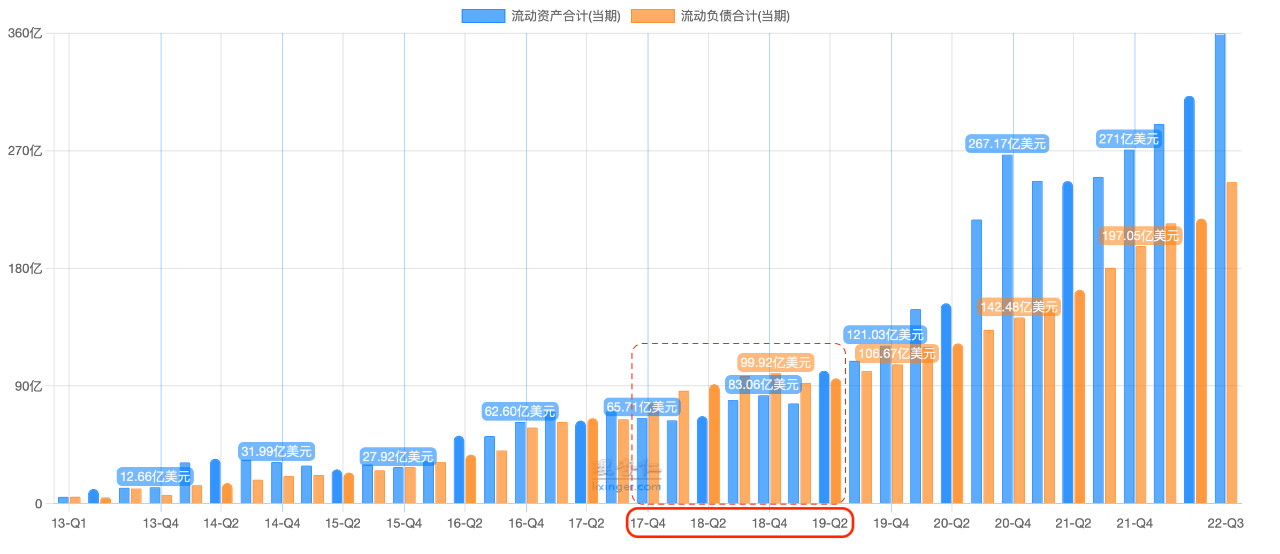
As shown in the following chart, before Q4 2017, Tesla’s short-term liquidity was barely enough to cover short-term debt, but from Q4 2017 to Q1 2019, it entered a liquidity crisis.
A liquidity crisis has a significant impact on a company. Lenders in the market will surely worry that the company cannot repay the money, and in addition to being unwilling to lend more funds, they may even ask for early repayment of the funds already lent out, ensuring the safety of the principal is the bank’s top priority. At this point, there may be a situation where the more you need money, the less you can borrow, and a death spiral might result.
It is not difficult to imagine that during that time, although Tesla did not reach the point of insolvency, it did indeed reach the edge of technical bankruptcy.But why did Tesla suddenly fall into a liquidity crisis between 2017 and 2019, despite performing well before?
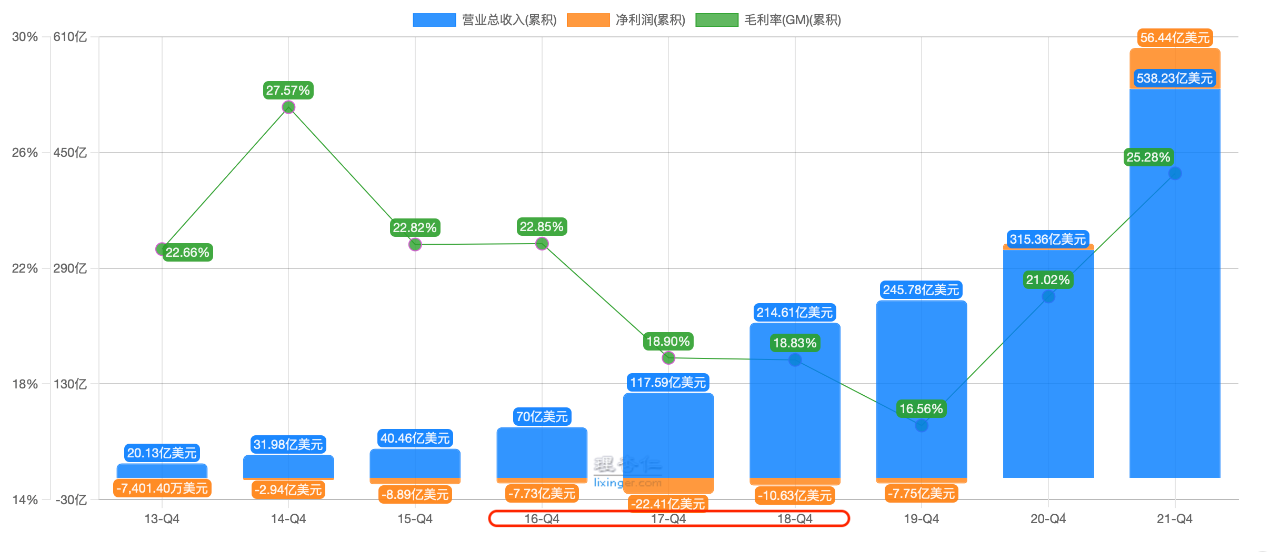
As shown in the chart below, Tesla’s revenue growth rate is still very high, but the company’s net losses suddenly increased threefold in 2017 compared to 2016. Although net losses are not directly related to liquidity, the reasons behind these losses are worth attention.
After reviewing the management reports of Tesla from Q1 2016 to Q4 2019, it was found that at the end of 2016, Tesla was preparing to mass-produce the new Model 3, which required the construction of new production lines. As a result, huge capital investments were made in 2017 and 2018 to build new factories and production lines using cash outflow.
It can be seen that Tesla spent USD 4.4 billion and USD 2.3 billion respectively on building new factories in 2017 and 2018. However, where did the money come from? In 2016 and 2017, Tesla raised USD 3.7 billion and USD 4.4 billion respectively through issuing new stocks and priority bonds.

From the financial data at the time, it can be said that Tesla’s investment in future production capacity was quite aggressive, basically treading the line of the company possibly falling into a liquidity crisis. However, this cash outflow alone wasn’t enough to land Tesla in a liquidity crisis from Q4 2017 to Q2 2019. There was a bigger issue that had yet to emerge.
Reviewing the quarterly management reports at that time revealed that the planned production capacity of the new factory was 10,000 units per week. However, after the new factory was completed and put into operation in July 2017, the actual production capacity in Q3 2017 was 18 units per week, climbing to 125 units per week in Q4.The management’s expectation given in the Q2 2017 quarterly report was to reach a production rate of 5,000 units per week by the end of 2017, but the ramp-up was severely below expectations. This was dubbed the “Production Hell” period by Elon Musk.
In the following quarters of 2018 and 2019, the actual production ramp-up numbers were: 800 units per week, 1,500 units per week, 4,500 units per week, 5,000 units per week, 5,000 units per week, 6,500 units per week, 6,500 units per week, and 7,200 units per week.
It is not an exaggeration to say that the period from mid-2017 to mid-2018 was the toughest time for Tesla, as a large amount of cash was invested in building factory buildings, while the efficiency of the production lines was slow to improve.
Finally, in Q3 2018, the situation began to improve as Model 3 production capacity increased to 4,500 units per week. At this point, Tesla had survived the most dangerous time and its operating cash flow began to turn positive and increase significantly. There was no longer a need to raise funds through new share and debt offerings, and the possibility of bankruptcy was greatly reduced.
Then the story of Tesla’s factory construction in China began. In Q3 2018, Tesla finalized the establishment of a super factory in Shanghai. The new factory started construction at the beginning of 2019 and was completed at the end of the year. In fact, the production line was already being tested in Q3 2019, producing a new generation of Model 3 made in China with a manufacturing cost 50% lower than that of the Fremont factory.As these business events brewed, fermented, exploded and resolved, Tesla’s market value curve started from 30 billion dollars and went all the way to 1 trillion dollars.
Of course, it’s hard to ignore the backdrop behind Tesla’s trillion-dollar market value, which is the global pandemic outbreak at the beginning of 2020. The crazy printing and massive liquidity injection of money by various countries have also created a huge wave in global asset prices.
This article is a translation by ChatGPT of a Chinese report from 42HOW. If you have any questions about it, please email bd@42how.com.