
Translation:
Author: Winslow
Body:
Word count: 1052 words
Expected reading time: 5 minutes
As the saying goes, “A gem cannot be polished without friction, nor a man perfected without trials.”
Today, let’s analyze Apple, a company that I have been continuously contemplating on lately, and see what kind of inspiration we can draw from it.
There are many ways to measure how much value a company creates, but efficiency in creating value can mainly be measured by the ROE indicator (Return on Equity).
Many terminologies may seem complicated and unapproachable, but the core essence of useful indicators is often simple. Stripped of its jargon, “ROE” refers to the ability of equity to generate net profit: total assets minus all liabilities equal the ability of equity to produce a return.
It can be simply understood as how much profit a company can generate for every dollar invested in it. Note that the “investment” here refers to financing, rather than purchasing publicly traded stocks in the secondary market. In other words, the money that the company can truly receive and use is considered as “investment”.
The following chart shows the annual report ROE for Apple from 2002 to 2021, and a brief interpretation: for example, the return on investment rate in 2002 was 1.62%, the return on investment rate in 2010 was 37.06%, and the return on investment rate in 2021 was 147.44%.
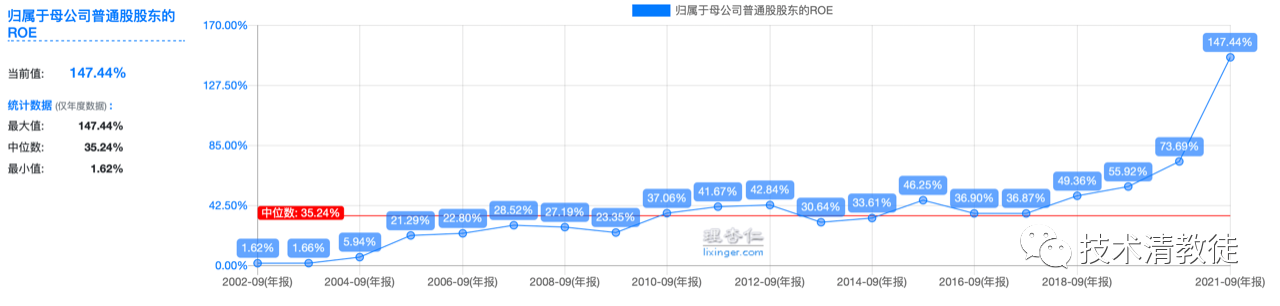
This chart can be basically divided into four stages:
- Initial Accumulation from 2002-2004 (ROE~5%)
- Steady Growth from 2005-2009 (ROE~28%)
- Accelerated Growth from 2010-2017 (ROE~46%)
- Super Returns from 2018-2021 (ROE~147%)
These four distinct stages can be further classified into two groups: the first three, which include Initial Accumulation from 2002-2004, Steady Growth from 2005-2009, and Accelerated Growth from 2010-2017, are mainly achieved through business operations: developing technology – selling products – expanding production capacity, forming a closed loop that improves ROE.
To understand the numbers, it’s often necessary to go back and see what Apple was doing during that time. During this period, Apple released two heavyweight products: the first-generation iPod in 2002 and the first-generation iPhone in 2007.It can be observed that Apple entered the steady growth phase from 2005 to 2009 and the accelerated growth phase from 2010 to 2017, mainly relying on the two super hot products, iPod and iPhone. Interestingly, both products took about three years after release to bring Apple’s ROE to the next level.
So, what products did Apple release during the super return phase from 2018 to 2021 (with a whopping 147% ROE)? Was it the Apple Watch or Airpods?
Neither.
During the super return period from 2018 to 2021, Apple started using a “trick” to reward shareholders on a large scale: dividends and buybacks.
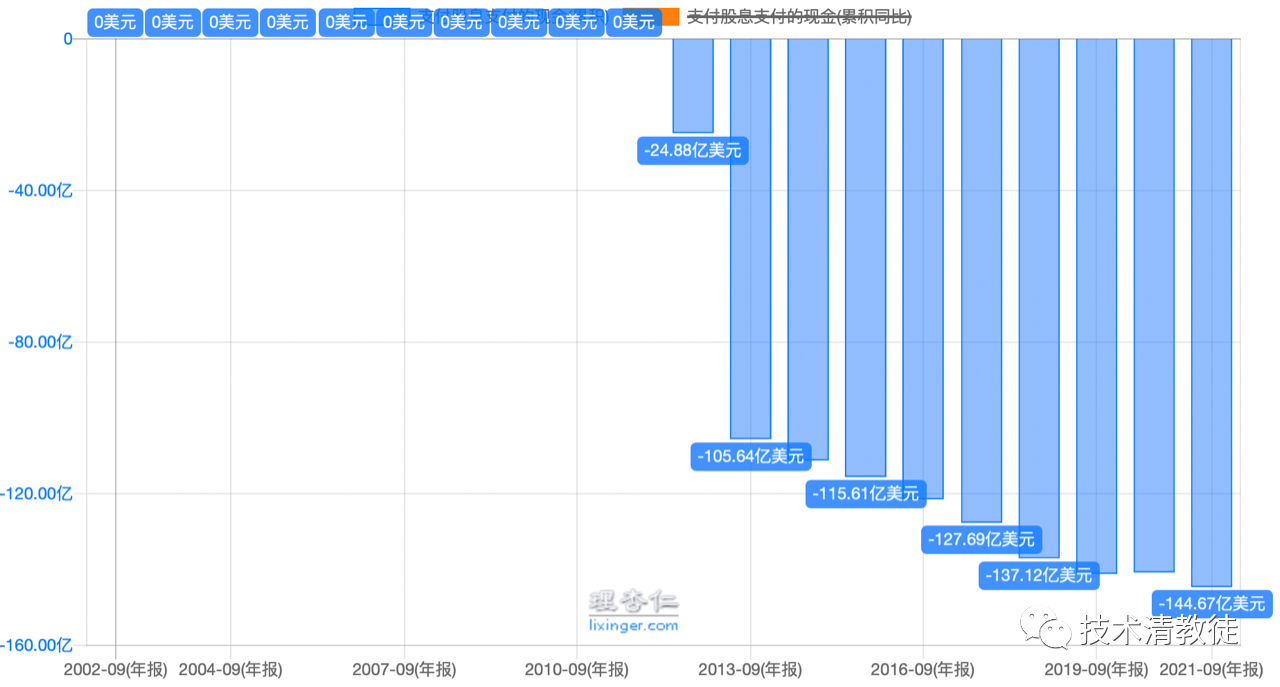
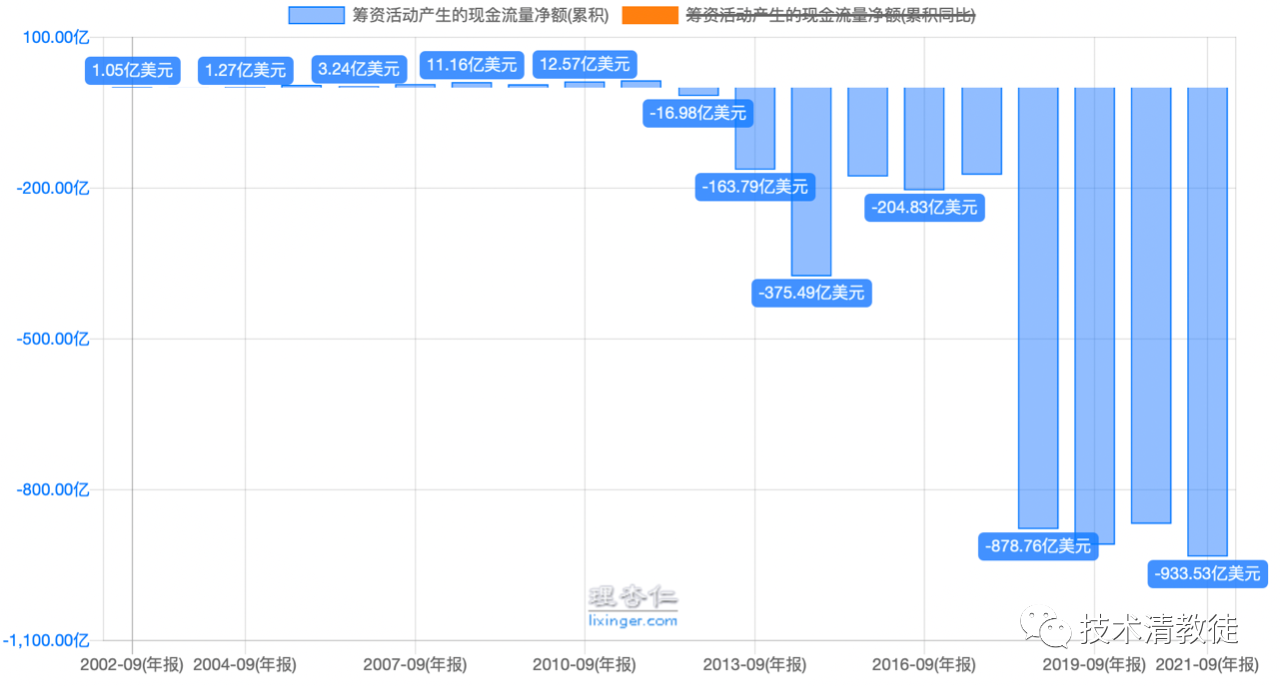
In fact, as early as 2012, Apple began its first dividend and buyback since 1995, but the amount was relatively small from 2012 to 2017. From 2018, Apple began to use debt to buy back its own stock on a large scale, with the annual buyback amount roughly equal to the net profit of the year, and even surpassing some.
This gave rise to the super return period from 2018 to 2021, and the main reason for the ROE reaching such a high level during this period was mainly due to financial means.
So why did Apple choose to increase the scale of buybacks in 2018?
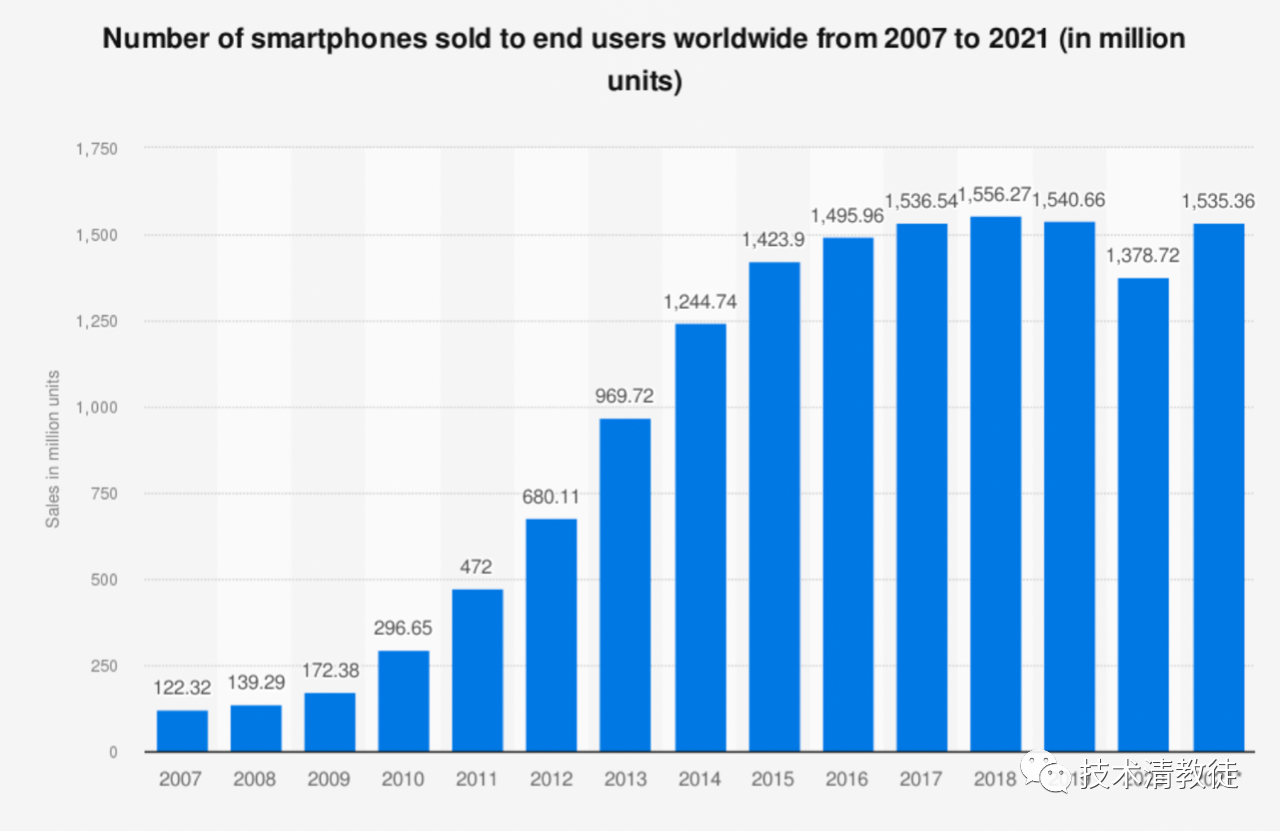
The above chart shows the annual sales data of the global smartphone market. It can be seen that since 2016, the total sales of smartphones have basically stayed at around 1.5 billion units per year, in other words, it has reached the ceiling of market capacity.
As mentioned earlier, various aspects of the steady growth phase and accelerated growth phase, such as research and development technology, product release, and capacity expansion, require a large amount of funding. Once entering the period of market saturation, free cash flow will increase significantly. If there is no better destination for free cash flow, dividends and buybacks may be Apple’s choice.
In the next article, we will continue to quantitatively analyze Apple and Tesla.
This article is a translation by ChatGPT of a Chinese report from 42HOW. If you have any questions about it, please email bd@42how.com.