Title: Why I remain bullish on Tesla?
Author: Winslow
Previous article: Methods of Studying Things
Why I remain bullish on Tesla?
Main Text:
1,830 words in total
Estimated reading time: 10 minutes
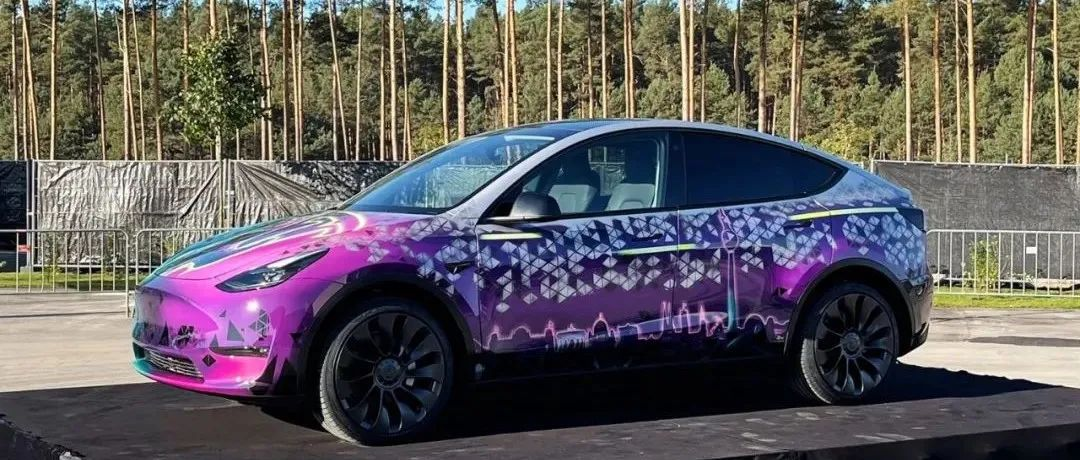
In the previous article, we talked about how the core essence of Tesla lies in Elon Musk and his team. To explain why I remain highly optimistic about Tesla in the long run, we need to start by analyzing this core essence. However, analyzing Elon Musk and the Tesla team is very difficult because people cannot be quantified like numbers.
Therefore, we proposed a “starting with the end in mind” analysis method in the previous article. To understand Elon Musk and his team, we can start by understanding Tesla’s products. Because the products are designed by them, their work style, values, thinking, and goals should run through the products from beginning to end.
We objectively understand Tesla’s products by breaking down the product data and facts into 5 dimensions: energy efficiency, performance, price, safety, and practicality.
Let’s read the data together.
Energy Efficiency
First, let’s take a look at InsideEV’s energy efficiency ranking, which shows the amount of electricity consumed per mile driven (wh/mile), representing the overall performance efficiency of the entire car.
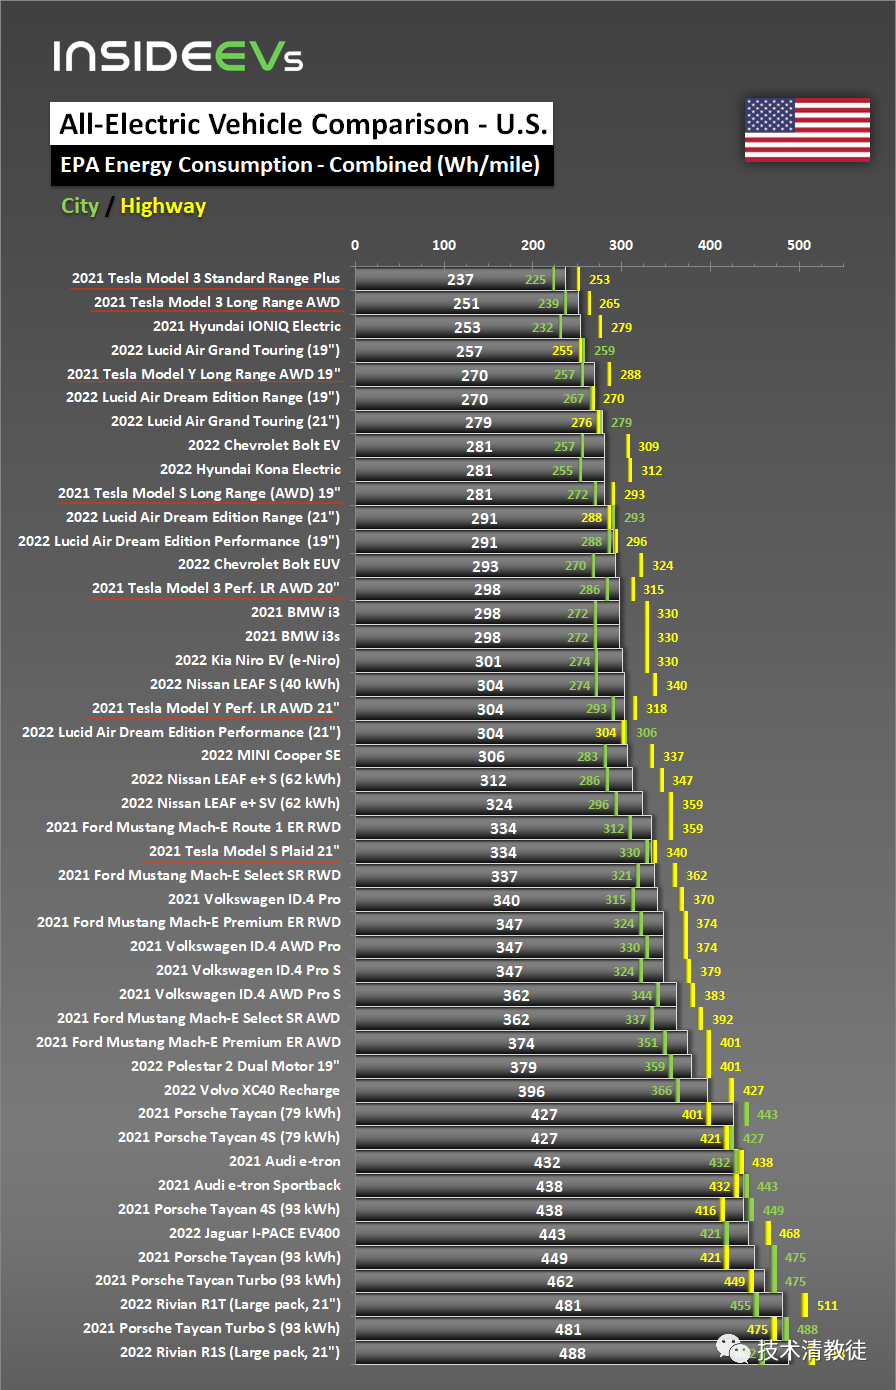
The red lines represent Tesla’s products, and it is clear that the energy consumption of the Model 3 Standard Range is the lowest, ranking first, followed by the Model 3 Long Range, and Hyundai IOINQ in third place. Tesla’s other models, the Model Y and Model S, are ranked fifth and tenth, respectively, while the energy efficiency of the performance version is further back. For example, the recently delivered Model S Plaid, touted as the world’s fastest production car, ranks only in the middle of the pack in terms of efficiency.
Performance
Looking at this, I have a general feeling that energy efficiency and performance are directly proportional, so let’s add the acceleration performance (blue numbers in the graph) to the car models in the graph.
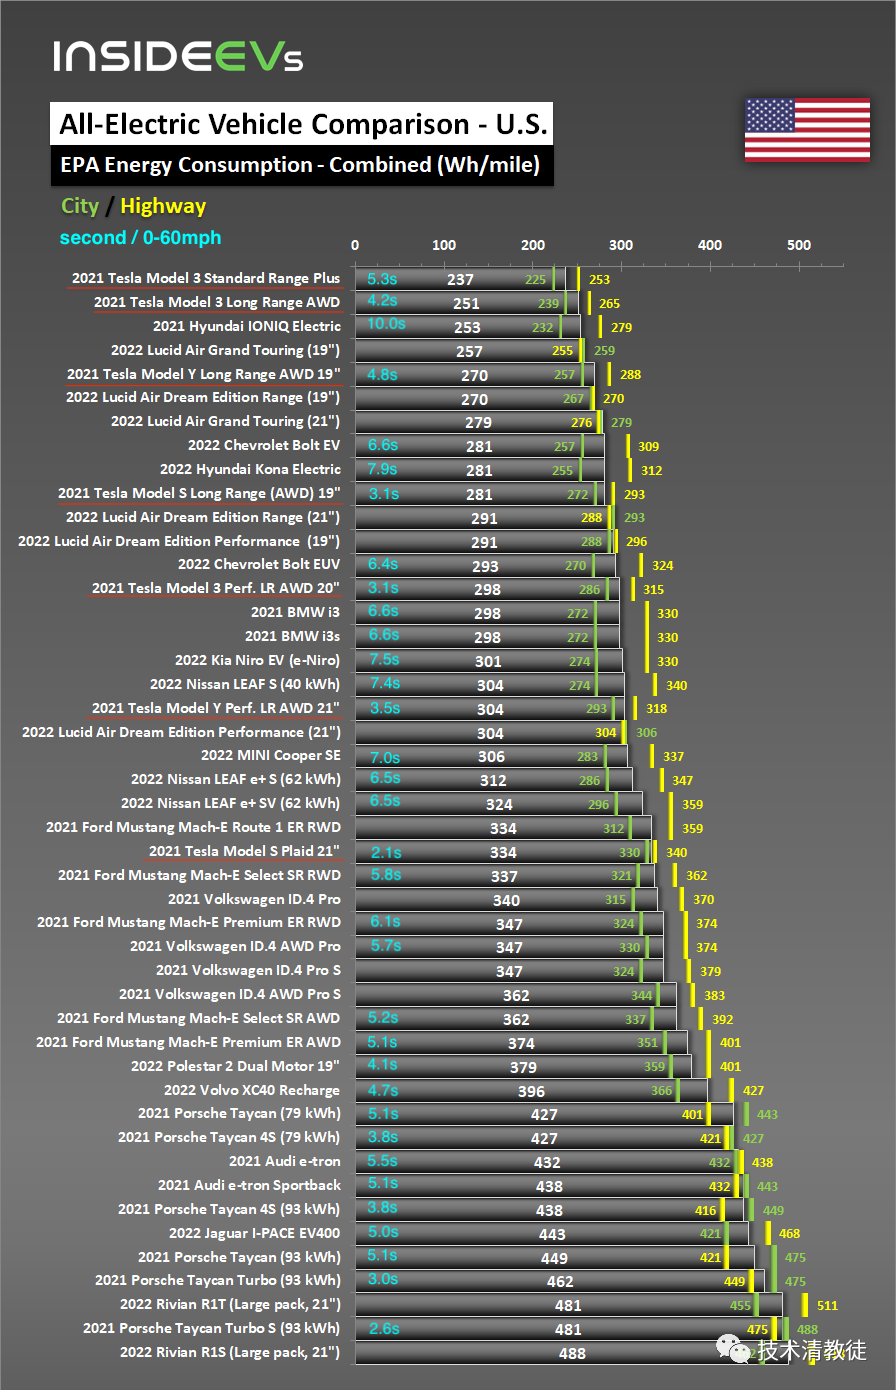
Overall, the car models with higher efficiency rankings have poorer acceleration performance, while those with lower efficiency rankings have better acceleration performance, just as we predicted. However, to be honest, this graph looks a bit weird to me. If we remove the red-lined car models, the graph becomes much more pleasing to the eye. Energy efficiency and performance are almost always proportional.Translate the Markdown Chinese text below into English Markdown text, keep the HTML tags inside the Markdown, and only output the results.
Therefore, Tesla is the relatively exceptional case. After including Tesla’s car models in the chart, it can be seen that Tesla can achieve relatively high performance with relatively low energy consumption. For example, the Model 3 Standard Range and Long Range achieve medium-ranking acceleration performance with the lowest energy consumption, and the Model S Plaid achieves first-place acceleration performance with medium energy consumption.
Price
In the past, people always said that Tesla was cutting the leek and that their cars were cheap, but were they really cheap? Now that we know Tesla’s energy consumption and performance level, let’s take a look at the cost, or the cost-performance ratio.
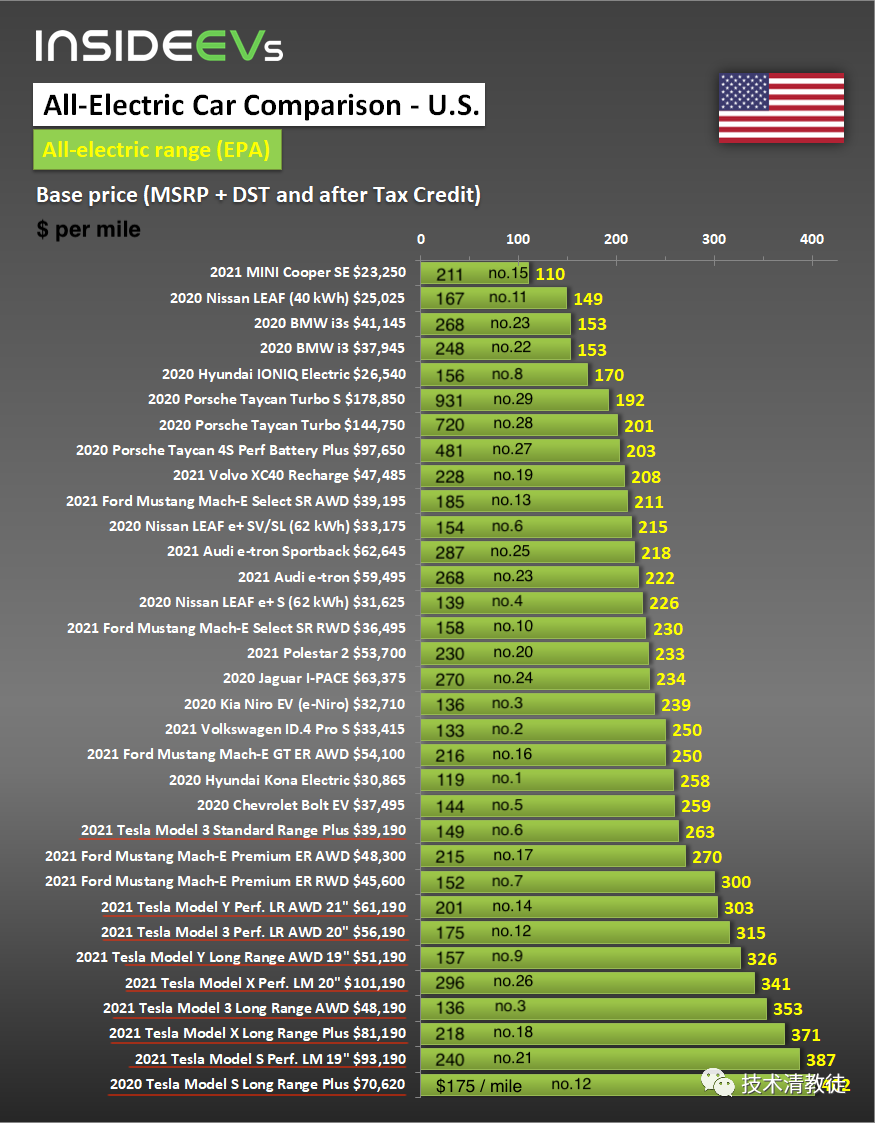
By dividing the selling price by the range (in dollars per mile), the Tesla Model 3 Long Range, Standard Range, and Model Y Long Range models can only rank 3rd, 6th, and 9th, respectively. Other models are further down the list.
Therefore, Tesla is not cheap in terms of cost per unit range or unit price multiplied by range. It is not even the cheapest electric car available on the market.
Safety
However, looking solely at energy consumption, performance, and price is not enough to fully represent cost-performance ratio, as there are many other factors to consider when it comes to cars. Safety is undoubtedly one of the most important factors.
So, how safe is Tesla?
Let’s look at the data directly.
All of Tesla’s car models, from the most affordable Model 3/Y to the twice as expensive Model S/X, have achieved the “all subcategories rated five stars” rating in the NHTSA safety test.
“What does the ‘all subcategories rated five stars’ mean?”
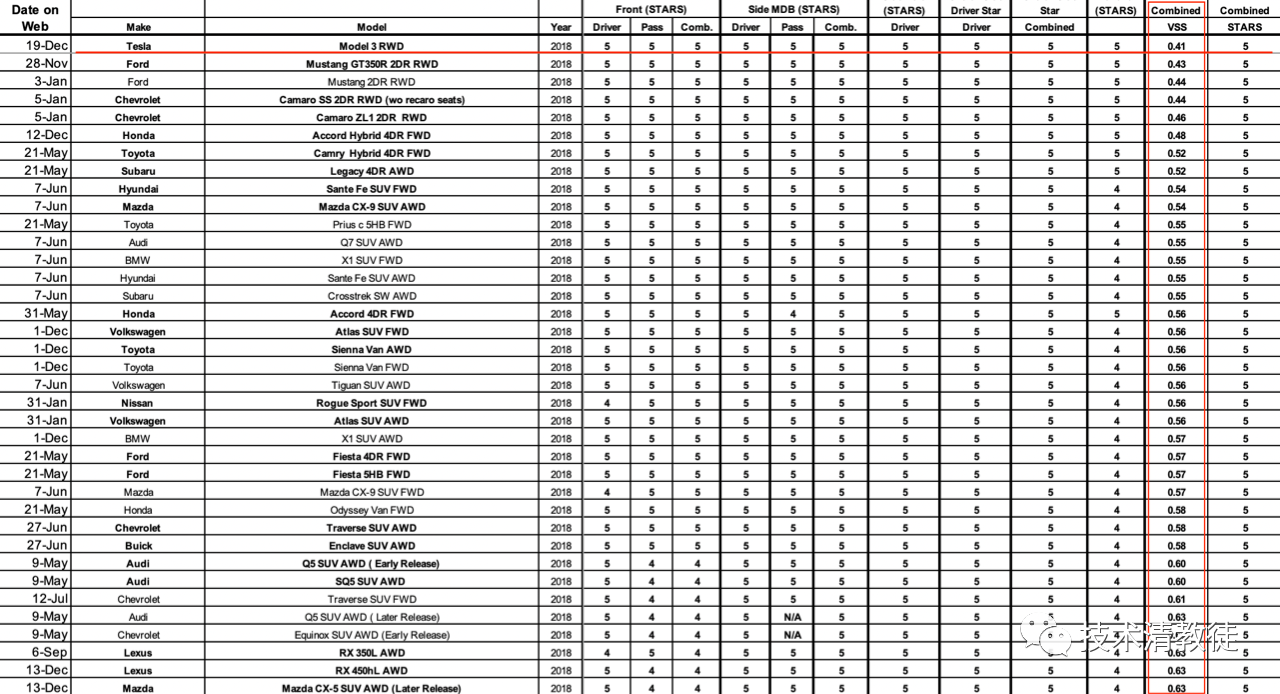
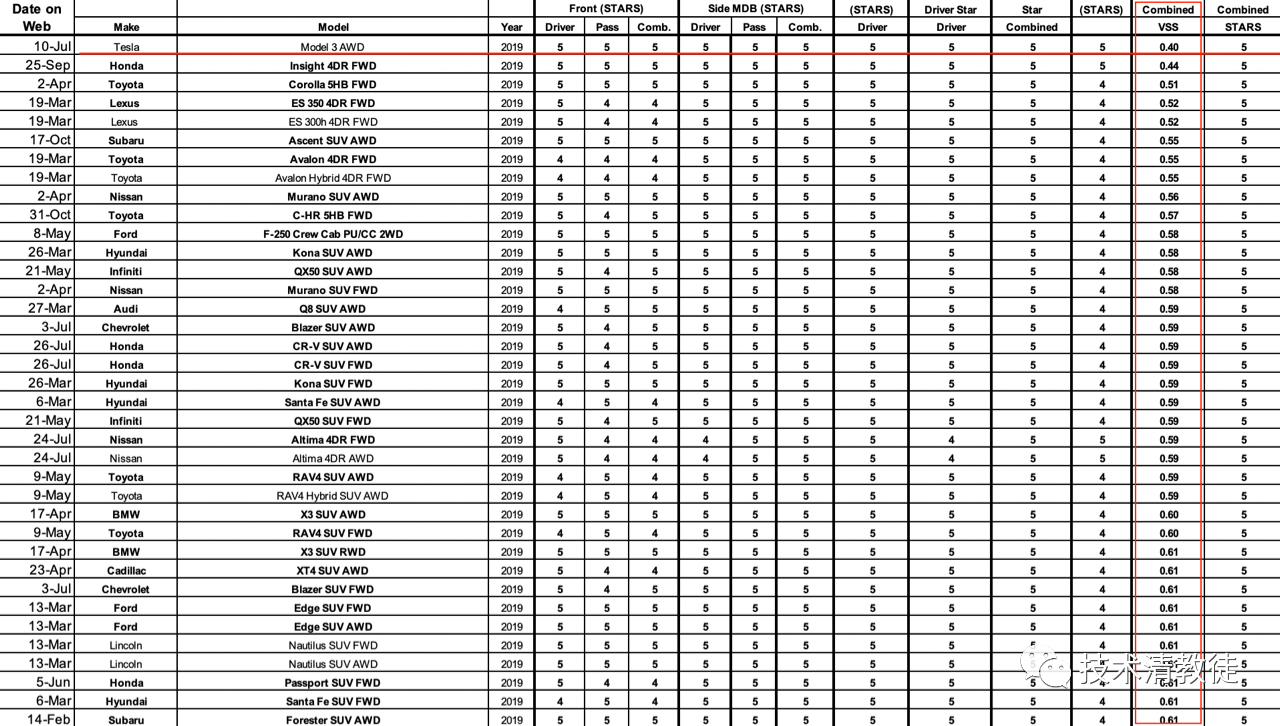
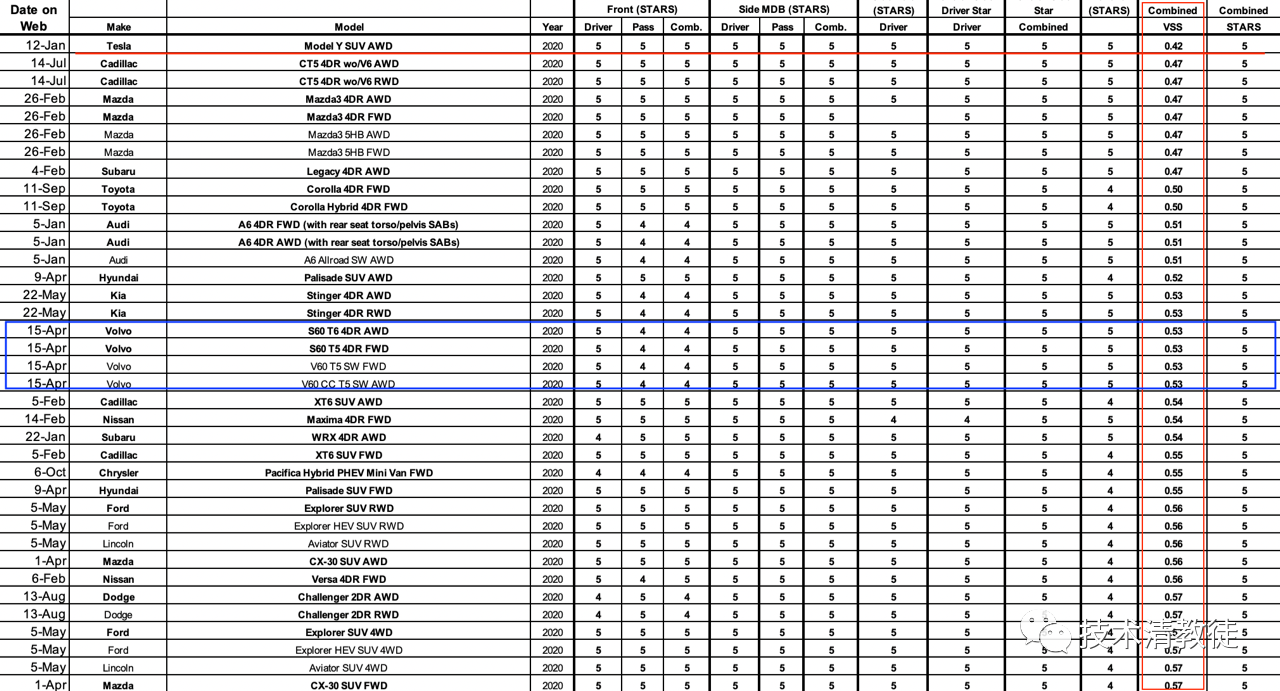
First, let’s look at the three following charts, which show the scores of all car models tested in NHTSA safety tests in 2018, 2019, and 2020, respectively. The circled VSS (Vehicle Safety Score) represents the overall safety of the vehicle, with lower scores meaning higher safety due to representing the probability of injury. Tesla’s Model 3 and Y are ranked first among all tested models in the past three years.
So what does “All Subprojects Get Five Stars” actually mean?
The last image we see is the appearance of the “world’s safest brand” Volvo (blue circle in the figure) among all the models tested in 2020. Upon closer inspection, it is found that Volvo’s test models received a “four-star” rating in the passenger injury star rating in the frontal crash subproject.
It can be seen that getting all subprojects to score five stars is not an easy task. If you want to win the crown of the safest overall score, it is even more difficult.
The data seen here is from 2018 onwards. So what was the top scorer for the overall safety score before 2018?
The answer is also Tesla, specifically Tesla’s Model S.
Since the launch of Model S/X, both models have been at the top of the NHTSA rankings, ranking first and second. Finally, in 2018, Tesla broke its own record with the introduction of the new Model 3, becoming the lowest accident risk model ever recorded by NHTSA, without exception.

Practicality
Finally, we come to the last dimension: practicality. For electric cars, the range is a must-have, and the range is the best reflection of whether it is practical or not.

All Tesla models, Mode 3, Y, S, X, monopolize the range of over 300 miles, ranking 1-8 on the range leaderboard, with the Ford Mach-E coming in at 9th and 10th. Only the Model 3 Standard Range is slightly behind, ranking 11th.
Conclusion
We have now analyzed the data for five dimensions, and for ease of understanding, I have extracted the data of several popular models from the article and made a comparison radar chart after conversion to percentage points: the worst score is 0 points, the best score is 100 points, and the middle data is calculated by the difference between the worst and the best scores.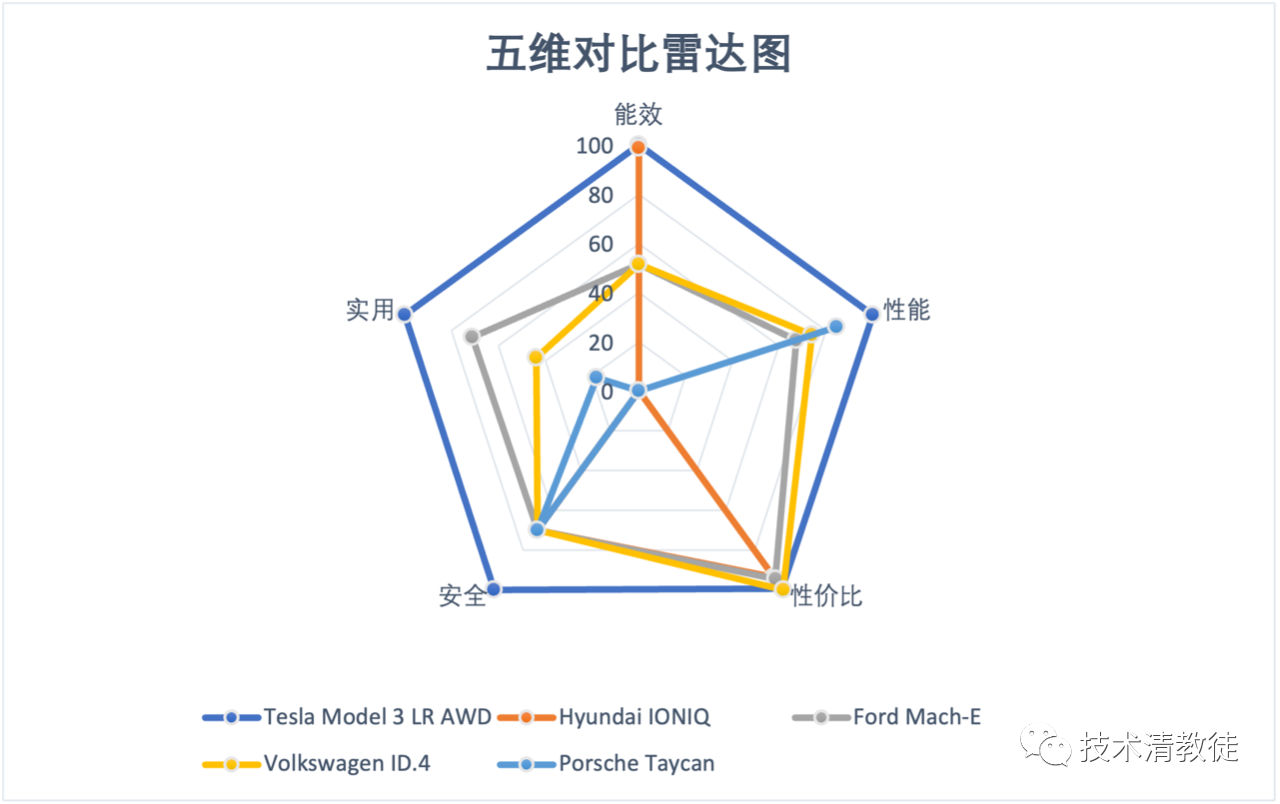
After reading this picture, it’s not an exaggeration to say that every aspect of Tesla’s products is almost like a watertight iron bucket.
Tesla is undoubtedly the best product you can buy on the market, without a doubt.
(to be continued…)
This article is a translation by ChatGPT of a Chinese report from 42HOW. If you have any questions about it, please email bd@42how.com.