According to the latest statistics from SNE, global production of power batteries reached 114.1 GWh in the first half of 2021, a 153.7% increase from the same period last year (45 GWh), which is directly linked to the growing demand for new energy vehicles. According to data from the Battery Alliance, China accounts for 46% of the total power battery consumption (52.5 GWh), with Europe not far behind. In addition, in June, the monthly output reached 25.4 GWh, which is higher than the monthly average. Based on this trend, if the supply problem of batteries is resolved, Q3 and Q4 may see growth rates similar to Q2, and the global power battery market is expected to reach around 250 GWh this year.
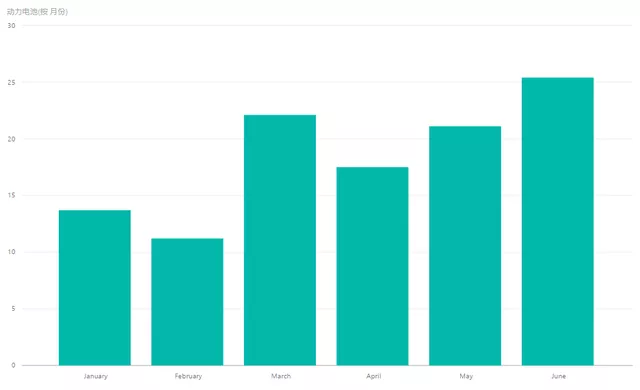
SNE’s Power Battery Statistics
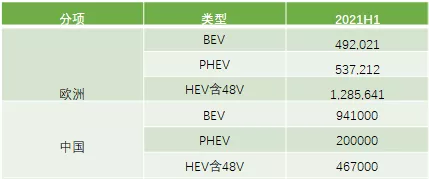
Let’s first take a look at the data on new energy vehicles from ACEA’s report. We can compare the data from China and Europe: China’s current BEV sales are leading, while Europe mainly promotes PHEV and HEV, and their sales growth rate is higher than expected.
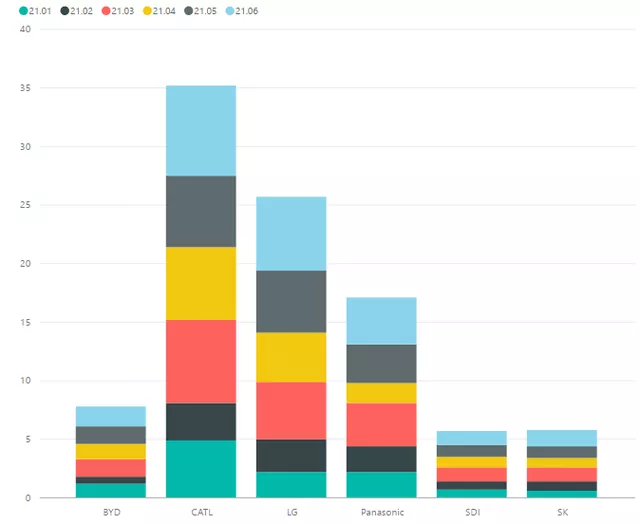
After discussing the growth of new energy vehicles, let’s return to the sales data of power batteries. Looking at the moment, battery suppliers in China and South Korea are continuously scaling up. In the first half of 2021:
-
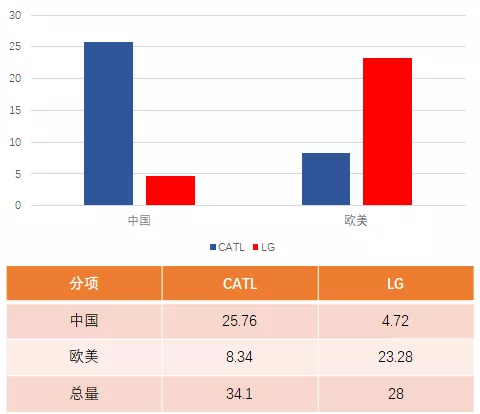
CATL ranked first with a total shipment volume of 34.1 GWh, a year-on-year growth of 234.2%. Of this, domestic shipments were 25.76 GWh, with a difference of 8.34 GWh between domestic and overseas installations. The reason for the difference should be due to exports, as well as the volume occupied by Tesla’s vehicles sold globally.
-
LG Energy Solutions ranked second in terms of shipments in the first half of the year, with a total of 28 GWh. LG is currently focused on the European market, with 4.72 GWh in domestic volume. The main source of LG’s sales growth is due to the increased sales of the Chinese version of Tesla Model Y, Volkswagen ID.3 & ID.4, and Ford Mach-E.
-
Panasonic: Panasonic has had the slowest growth in production this year, with a shipment volume of 17.1 GWh in the first half of the year. Since its exclusive partnership with Tesla, Panasonic lost a good opportunity to move forward by following Toyota.
-
BYD: With a shipment volume of 7.8 GWh, BYD ranks fourth in the world, with a year-on-year increase of 203.6%.SDI: The shipment volume is 5.9GWh, a year-on-year increase of 107.3%. SDI is the world’s largest PHEV battery supplier, and the number of batteries supplied is even more when counted by sets. However, the number is slightly reduced when counted by GWH. Currently, the BEVs that use SDI’s battery mainly include the Fiat-E500 and Audi’s E-tron EV. Therefore, the demand for SDI will increase significantly when the PPE platform comes in 2022.
SK: The shipment volume for the first half of the year is 5.9GWh. However, with the increase in sales of Kona EV (European version) and Loniq 5, the production in the second half of the year will also increase rapidly. In addition, with the launch of Kia EV6, the supply chain changes of SK are expected to be more evident in the second half of the year. Currently, SK is still highly dependent on the demand of Hyundai and Kia.
Finally, regarding the part exported by CATL, the data for SNE is 8.34GWh, and its main customers include Tesla, Stellantis, Mercedes-Benz, etc. With the further improvement of the domestic Tesla market, the competition between Ningde and LG in the second half of the year will become more fierce.
Comparison of Energy Storage batteries and Power batteries
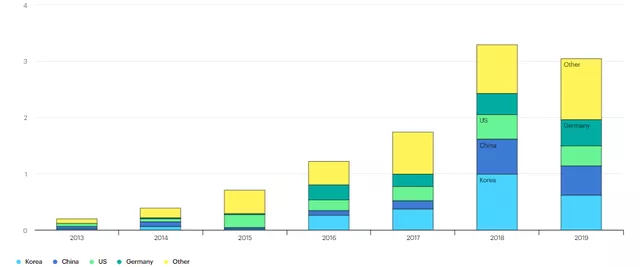
In order to make a comparison with power batteries, I think it’s also necessary to include the data of ESS, which are both large batteries, to track and analyze the data. With the further increase in the expectations of energy storage and the continuous expansion of new energy abroad, putting the data of energy storage batteries and power batteries together will have certain significance.
Currently, the data source for ESS may be a bit problematic. The next step is to find a more accurate data source, such as quarterly or semi-annual data.
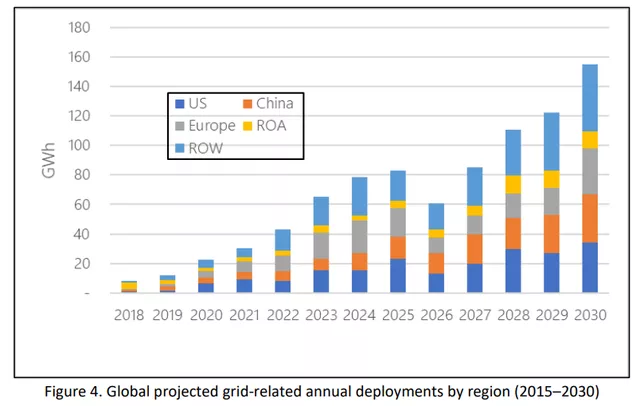
In IEA, there is a report as shown in the above Figure 5, but the data doesn’t match.
Summary: It seems that I have been writing about batteries recently, and I will start writing about other topics after finishing this article.
This article is a translation by ChatGPT of a Chinese report from 42HOW. If you have any questions about it, please email bd@42how.com.