The global power battery installation data released by SNE this month is relatively late, but the data for this month is very interesting, with several key points:
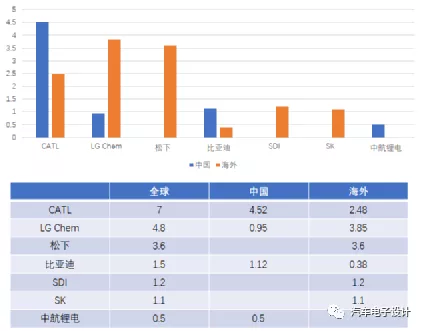
1) The global installation volume in March was 22.1 GWh, compared with 9 Gwh in China in March. In the long run, overseas demand will be higher than domestic demand.
2) Ningde’s overseas installation volume in March, if the domestic installation volume subtracted by SNE-China Association of Automobile Manufacturing, was 2.48 GWh, which means that the monthly overseas installation volume accounted for 54% of the domestic volume. This data is stunning.
3) If Ningde and LG Chem’s volume in overseas are compared, one is 2.48 GWh and the other is 3.85 GWh. Compared to last year, while Renault and PSA’s usage declined, the proportion of European battery usage to that of China further increased.
Power Battery Installation
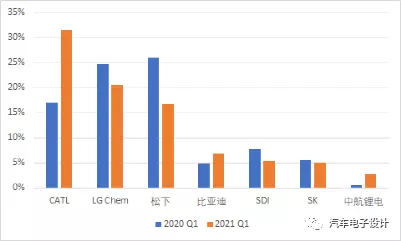
Due to the end-of-quarter effect, the global electric vehicle battery market grew 2.5 times year-on-year in March, with an installation capacity of 22.1 GWh (corresponding to 9 GWh in China), which means that China accounts for about 40% of the global usage for that month, while the Q1 ratio is about 48.5%. As demand in Europe and the United States is increasing, the competition for the overseas market has become more important.
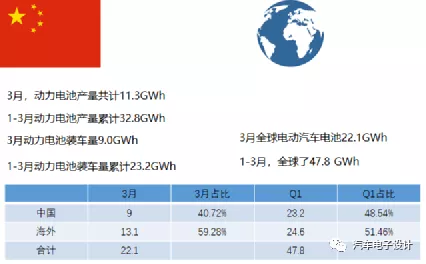
Among the global usage, Ningde’s volume is growing rapidly and currently ranks second overseas, only behind LG and Panasonic. In fact, from this month’s perspective, the supply to Europe has reached 2.58 GWh (which matches the Q1 export of power battery shipments worth 2.517 billion yuan in the quarterly report).
Currently, the other two Korean battery companies need to pay attention to the following points. Both rely on major customers, and Samsung SDI’s growth of 1.2 GWh is driven by the increase in sales of Audi E-tron (which effectively reduces LG Chem’s use of soft packs) and Fiat 500e.
SK Innovation’s sales were boosted by the good sales of Kia Niro EV and Hyundai Kona EV (Europe), which was also separated from LG Chem.
Note: SK Innovation’s usage will further increase as Hyundai-Kia’s 800V system is delivered in the next step.
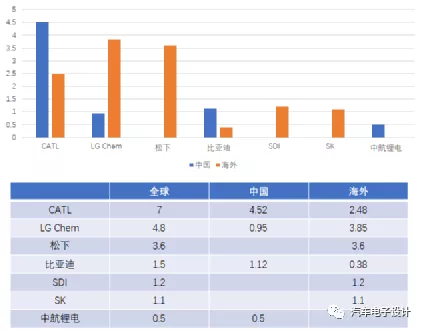
Overseas Market DemandIf we compare LG Chem and CATL separately, taking a relatively large share of European supply under the stable conditions of the domestic market, with reference to the overseas figure of 12.61 GWh, in March, the market share of Ningde was around 20%, while that of LG and Panasonic were 30% and 28% respectively.
In March, LG’s main usage included 10,000 Tesla Model Ys manufactured in China, as well as the Volkswagen ID.3 and Ford Mustang Mach-E in Europe, but Renault ZOE, among others, stalled last year.
The changes in market share also reflect the current situation, as we can observe the shift from an overall Korean supply to the introduction of Chinese supply in the European power battery market in 2021, with local European power batteries estimated to account for a portion by 2023.
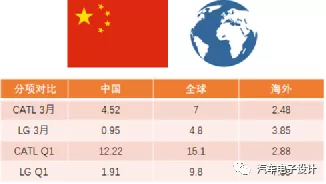
A portion of data on the industry will emerge after May, and I will compare the differences between SNE and EV Volumes. The data for the global market in March was quite surprising due to a significant inflection point.
Assuming a quarterly demand of 50 GWh worldwide, the global demand for this year will reach 200 GWh. With a market share of 40%, this equals 80 GWh, which still differs from the 120 GWh mentioned before. We will continue to monitor the actual realization of this 120 GWh.
Conclusion
This article is a translation by ChatGPT of a Chinese report from 42HOW. If you have any questions about it, please email bd@42how.com.
