Any activity that is done for a long time will have an impact. Currently, the testing report on energy storage batteries by ITP Renewables has become very authoritative. In March 2021, they updated “Public Report 10 Lithium-ion Battery Testing.”
I haven’t paid much attention to this field for a long time, and maybe Report 11 will be released in a while, but this time I will focus on this material, especially on the performance of Tesla Powerwall in this series of tests.
Phase one tested eight different energy storage batteries.
Phase two added 10 battery tests.
Phase three: batteries.
These public data relatively objectively show the current battery performance, capacity retention rate, and charge and discharge efficiency, providing both intuitive understanding and objective reflection of which batteries are more suitable for energy storage applications in the future.
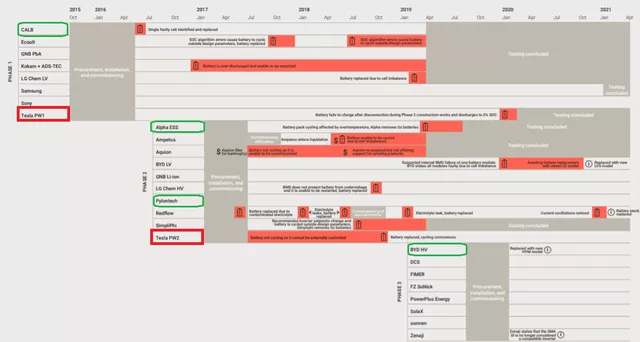
In the first part, I want to summarize the performance of Tesla Powerwall 1 and Powerwall 2 written yesterday, and in the second part, I will look at the performance of several domestic energy storage companies.
Performance of Tesla Powerwall
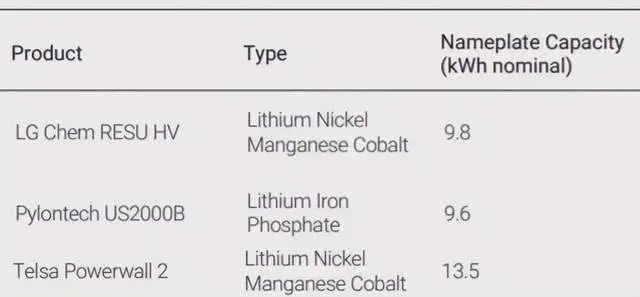
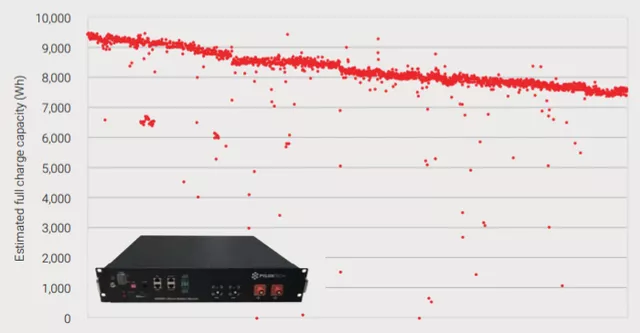
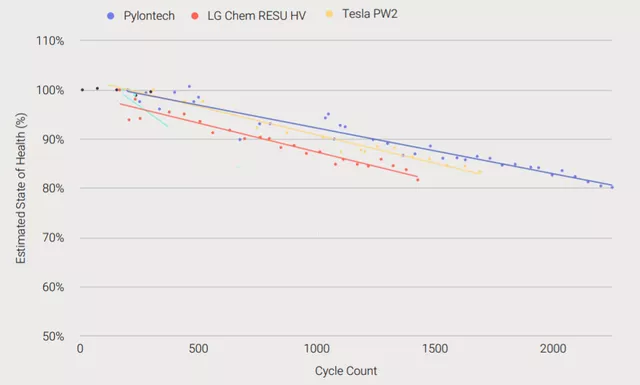
In this report, the actual performance of Tesla Powerwall in the first phase was not complete. The effective data are shown in the figure below, which was previously included in the reports we saw. Based on actual test data, Tesla Powerwall 2 tested at about 1700 cycles, with a capacity decay of around 83%. According to the estimation of SOH and the linear regression between cycles, Tesla Powerwall 2 will have about 60% capacity after about 3,680 cycles (of course, the decay rate may accelerate in the later stages).
Note: The Tesla Powerwall 2 is experiencing small jumps in SOC at the end of the discharge cycle (7% to 0%) and the start of the charge cycle (0% to 9%) but this does not impact cycling.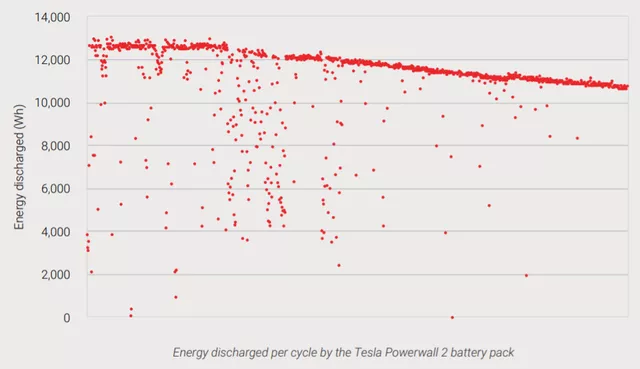
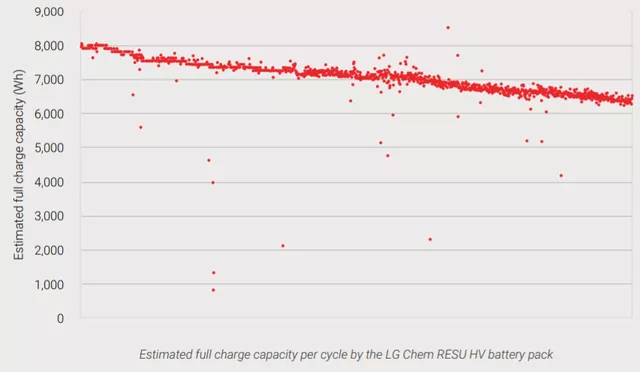
Compared to LG’s soft pack energy storage battery, Tesla’s Powerwall 2 product is slightly better. After 1500 cycles, LG’s ternary soft pack core has dropped to around 82%. If linearly extrapolated, it will reach 60% capacity after approximately 3330 cycles.
In the second stage of testing, PYLONTECH’s US2000B performed the best, reaching 80% at around 2300 cycles and estimated to reach 60% capacity in 4,470 cycles.
This is an overview of the fitting situation of the three main products in the second stage, and the overall decay rate has a clear curve.
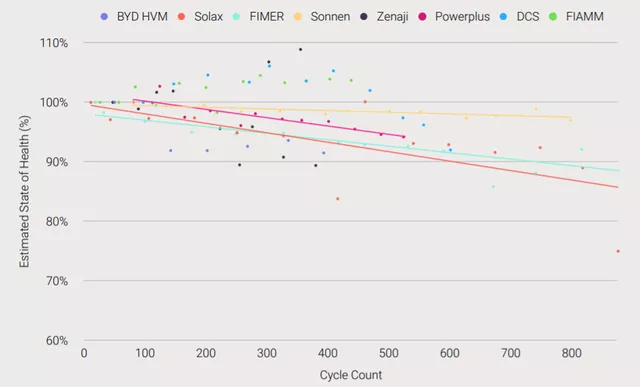
Results of the third stage of testing
In the results of the third stage of testing, some magical data appeared, indicating that some products may have stored electricity.
At 100-500 cycles, including DCS, Zenaji, and FIAMM, they all ran at 100% capacity and above. Among all the products, sonnenBatterie, which also uses iron-phosphate products (with Sony as the supplier?), can reach 60% after 14370 cycles according to the fitted curve.
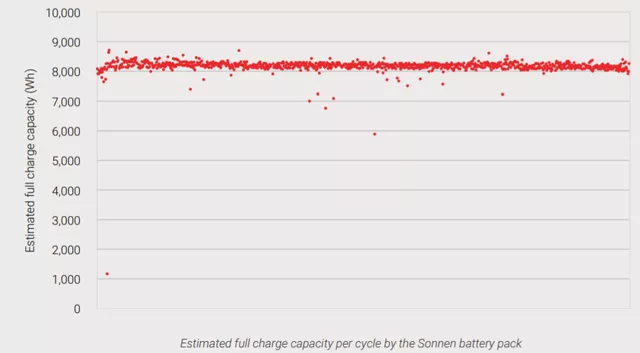
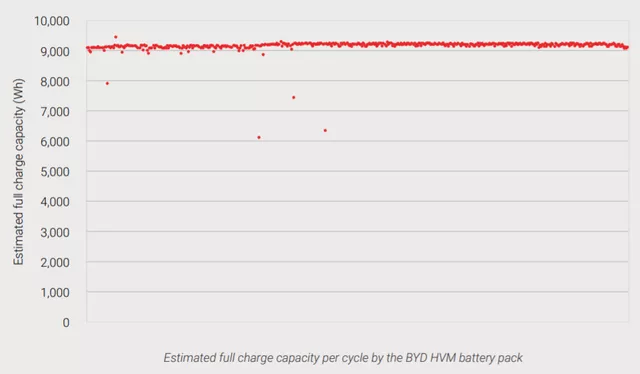
SonnenBatterie’s test situation is that there is no obvious decay after about 800 cycles. Interestingly, BYD’s energy storage battery also has no obvious decay after 400 cycles.The cycle effect of sonnenBatterie is shown in Figure 7:
The cycle effect of BYD is shown in Figure 8:
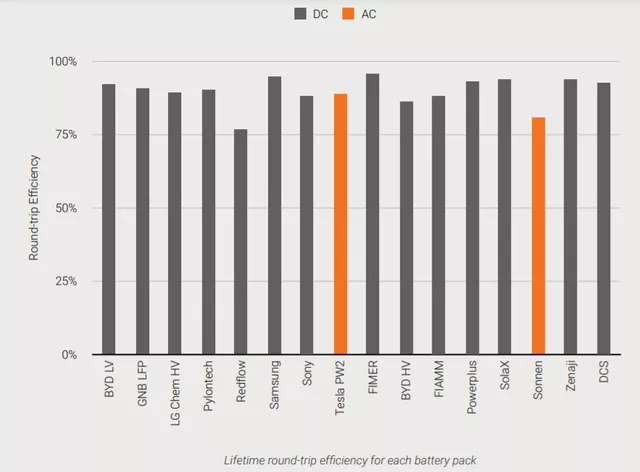
The efficiency characteristics of these products are basically not significantly different.
The throughput efficiency of energy storage products is shown in Figure 9:
In conclusion, I will update the information after Report 11 is released. From the current cycle characteristics, lithium iron phosphate should be a better choice for energy storage than ternary, which is also the core reason why Tesla started switching from ternary to lithium iron phosphate for energy storage.
This article is a translation by ChatGPT of a Chinese report from 42HOW. If you have any questions about it, please email bd@42how.com.