Just received the car insurance data for August, there are many things worth our attention this month.
From a macro perspective:
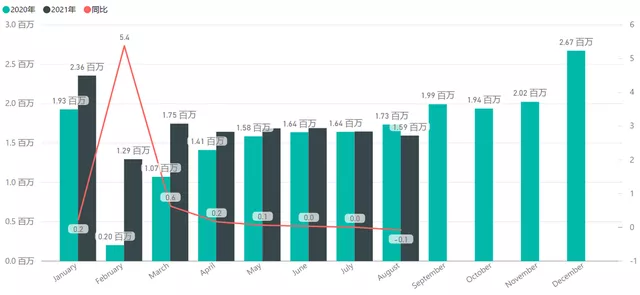
1) In August, the overall car insurance data for passenger vehicles was 1.594 million, a year-on-year decrease of 8.1%. This is the first year-on-year decrease since July 2020. The base data for September 2020 was 1.992 million, and the growth rate will definitely face great challenges in the months from September to December.
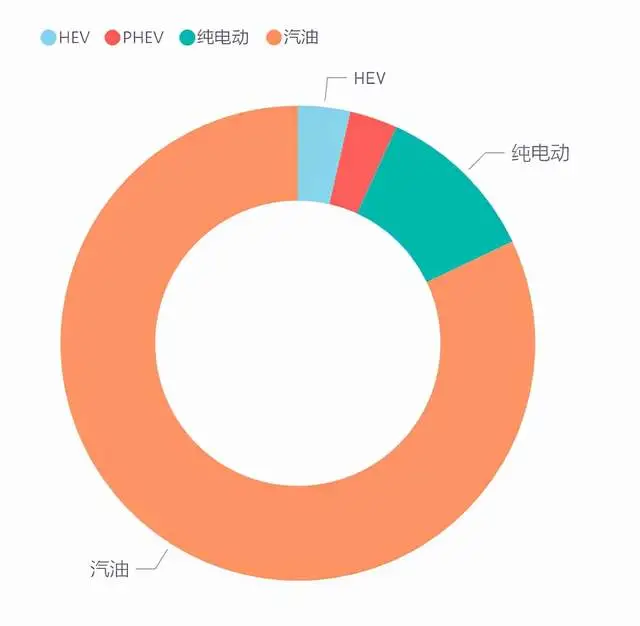
2) The situation of insurance for new energy vehicles is still very good, with a total of 230,000 vehicles, including 178,000 pure electric vehicles (penetration rate of 11.11%) and 52,100 plug-in hybrid PHEVs (3.54%), which has increased the penetration rate to 14.37%. This is a very impressive data.
Overall insurance data for the industry
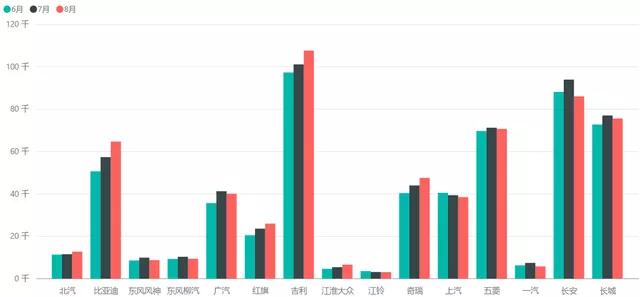
The insurance data of domestic automakers are relatively stable, and from the terminal data, they have not been affected too much by the shortage of chips. Brands like Geely, BYD and Chery have all seen a slight increase.
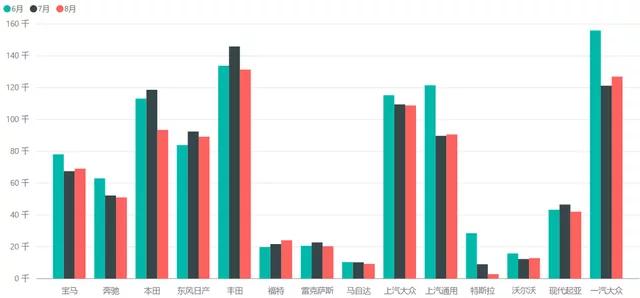
In contrast, the situation of foreign-funded enterprises is gradually declining month by month, and the decline is relatively large. This trend may become more apparent in the coming months.
I compared the penetration rates of new energy vehicles for brands with sales exceeding 15,000 vehicles per month. The highest is BYD, which has achieved a very successful result of 40% for BEV and 38% for PHEV. The second is Wuling, which has the highest penetration rate of BEV among traditional automakers, reaching 52% through Mini EV. Next is Roewe, with 25% for pure electric and 7% for PHEV. GAC and Chery have also performed well, with penetration rates of 20%-30%. Other mainstream brands still have very low penetration rates.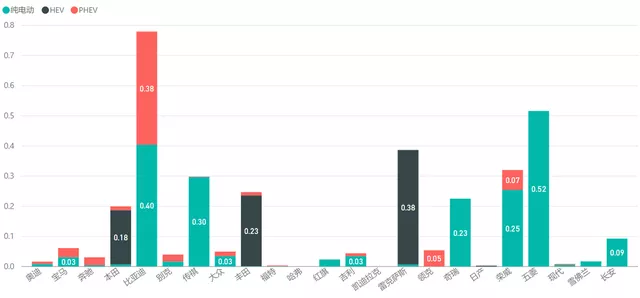
Among the brands with sales below 15,000, the pure electric vehicle penetration rates of Beijing and CHJ are still very good. Of course, all new carmakers are 100%.
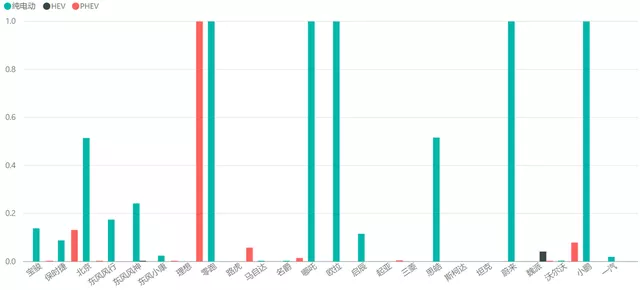
The Situation of New Energy Vehicles
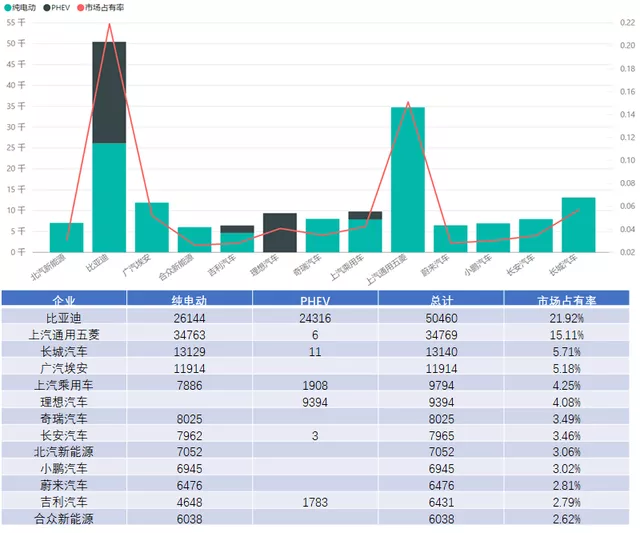
What surprised me the most about the August data was that Tesla was not in the top ten in terms of the number of insurance policies. BYD’s 50,000 units meant that BYD’s market share exceeded 21.92%. Wuling ranked second with a market share of 15.11%, and Great Wall ranked third with a total of 13,140 units and a share of 5.71%.
Note: I underestimated BYD’s rise in 2021, and many places need to think about the overall logic. BYD’s momentum this year is really different from previous years.
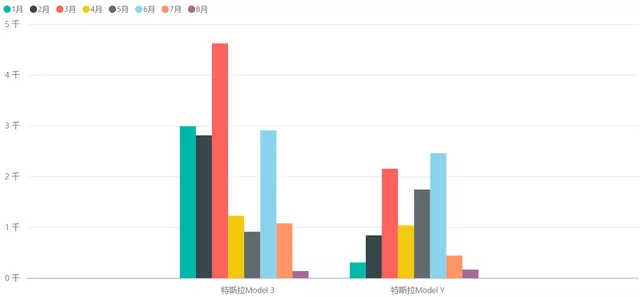
In August, Tesla’s insurance data was a bit unbelievable. Model 3 was 1,273 units (a decrease of 5,300 compared to the previous month), and Model Y was 1,529 units (a decrease of 800 compared to the previous month).
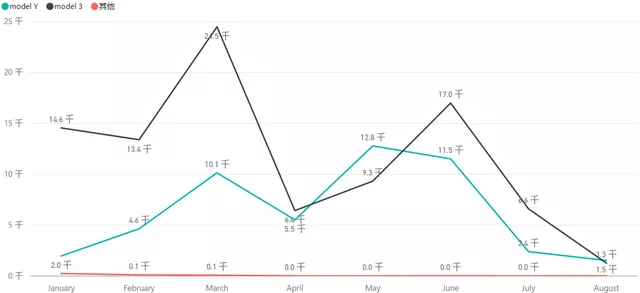
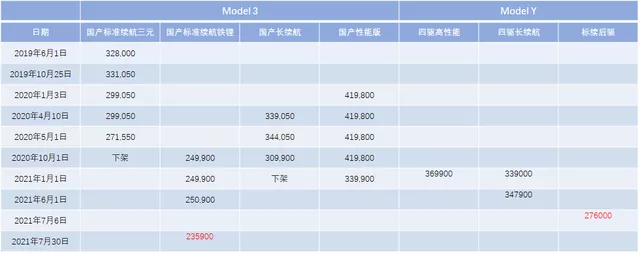
From my understanding, this stage is very related to the price system switch of Tesla. As shown in the figure below, the switch time points were July 6th and July 30th. That is to say, the 6th day’s price reduction of Model Y caused the insurance data of Model Y to increase from 11,500 in June to 2.4K and 1.3K before the official delivery of Model Y in July-August. The price reduction on July 30th had little impact on the 6.6K of Model 3 in July, but had a big impact on the 1.3K in August.According to the data provided by Ann, the main difference here is that the delivery of Model Y standard range has already started in August, with nearly 10,000 units recorded by China Passenger Car Association (CPCA), while only 1,500 units were insured. This accounts for the discrepancy in data, with 8,500 Model Y standard range units not yet registered, which will be added to the numbers in September.
We will need to track the data from September to November to assess Tesla’s sales demand. Personally, I believe that even if Model 3 is lowered in price, the impact will not be particularly significant. Monthly demand may fluctuate between 6,000 to 17,000 units on average. I have reason to believe that the demand for Model 3 in Q2 was at a normal level, and Q1 was affected by the demand squeeze in Shanghai (similar to some restricted purchase areas); As for Model Y, due to its entry into the 300,000 price range, there may be a new high in Q4.
This article is a translation by ChatGPT of a Chinese report from 42HOW. If you have any questions about it, please email bd@42how.com.