On June 1st, the global power battery data for SNE finally came out, and with the data from several Korean brokerages, I have sorted and analyzed the global power battery industry from April to present in 2021. Let me break it down:
Overview of the Power Battery Market
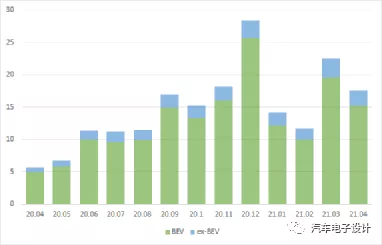
First of all, let’s take a look at the overall situation. In April of this year, the global power battery installation reached 17.5GWh, and the cumulative installation from January to April was 65.9GWh. From the overall trend, there are the following characteristics:
1) The installation volume in the pure electric direction is 15.3GWh, which remains high. The total demand for HEV and PHEV is only 2.2GWh.
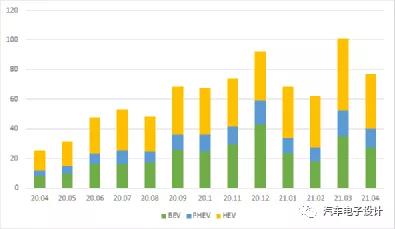
2) Looking more closely, there were a total of 772,000 xEV (HEV+PHEV+BEV) units worldwide in April. Of these, 275,000 were BEV, closing in on the 371,000 HEV units. There were only 126,000 PHEV units worldwide. Combined with the demand of 27.5 million BEVs and only 2.2GWh demand for non-BEVs, you can understand that the demand for resources from BEVs is still very high. From the chart below, the numbers for all of these data points are very promising, with all of them expanding.
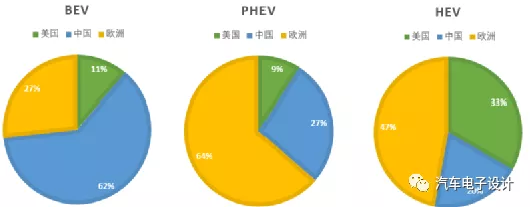
3) Looking at the regional breakdown, more than half of the PHEVs are in Europe (77,000 units), while China and the United States only have a total of 44,000 units. Currently, China’s BEV market is the healthiest in the world due to the special advantages of A00-level and license promotions outside of subsidies. From the development of HEVs, we can see that they are relatively mature in Europe and the United States. Domestic HEV development has yet to be given major attention.
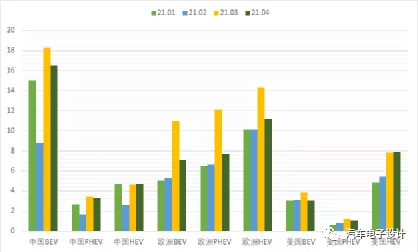
Due to historical reasons, our strategic direction for pure electric drive (especially BEV) is still very clear, which is reflected in the fact that China’s volume accounts for a large part of it in the market.
 ## Performance by Supplier
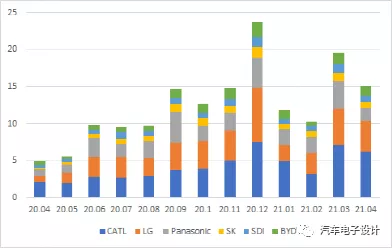
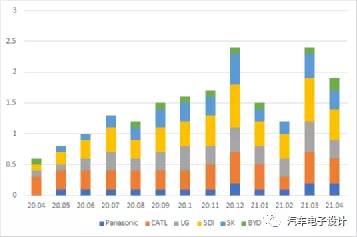
The current battery market has seen significant gaps in monthly GWh outputs. The top ten companies in terms of installation volumes from January to April were dominated by Chinese enterprises such as CATL, BYD, CEA, and Guoxuan High-Tech, all of which achieved triple-digit year-over-year growth rates. CEA experienced an outstanding YoY growth rate of up to 633.3%. In April, CATL installed 6.2GWh worldwide, surpassing LG Chem’s 4.2GWh. As for Panasonic, their installation was just 1.7GWh due to lower shipments from Tesla. Accumulatively, NCM installation totals from January to April worldwide were 21.4GWh, which is 5GWh higher than the domestic installation volumes provided by the Battery Joint Innovation Centre under the guidance of CATARC.
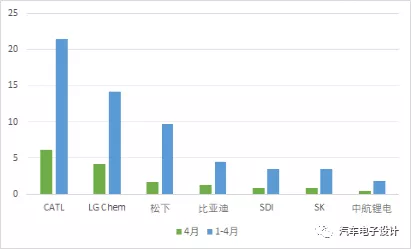
Currently, the competition in the market is mainly between LG Chem and CATL. LG Chem’s biggest problem is the significant impact brought by KONA and Bolt EV last year.
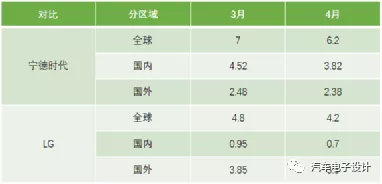
To address this problem, I created a table comparing the differences between LG Chem and CATL in March and April, using SNE’s data (global installation volume) and the data from the Battery Joint Innovation Centre under the guidance of CATARC (domestic certification).
I also conducted an analysis by ranking the sales of major battery suppliers among the top brands globally for April. One main application of NCM batteries from Ningde times in March and April is Tesla’s LFP Model 3 version, which MG and Opel chose for their EVs in addition to some Mercedes vehicles.
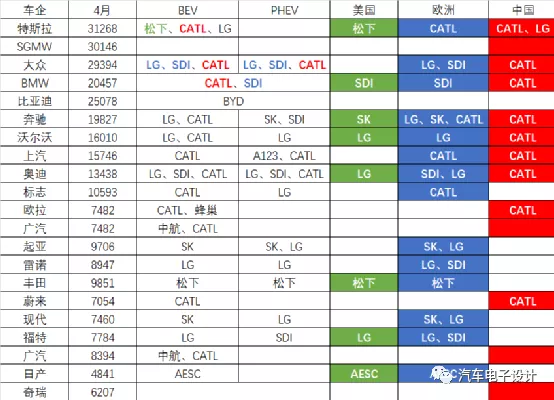 According to data from several major sources in Europe (JATO, EVsales, and SNE), it can be calculated that some of the main BEV models in Europe are LG with approximately 1.52GWh, SDI with 0.248GWh, SJ with 4.04GWh, and CATL with 9.59GWh (mainly Tesla’s 14,000 exported vehicles).
Note: I estimate that SNE also calculates based on the amount of electricity per vehicle, but it is currently unclear which foreign cars the 5GWh from CATL is going to.
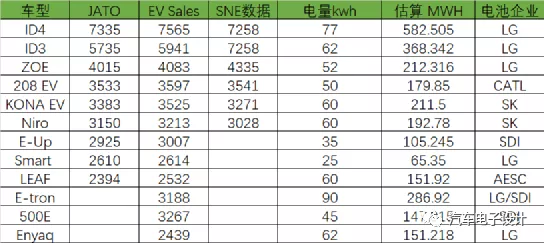
From a global perspective, SDI is currently the largest PHEV battery supplier. Although there have been accidents involving BMW and Ford batteries, with improvements in production, demand has basically returned to previous levels. In Europe, there are no particularly good choices for PHEV batteries, and SDI’s PHEV batteries are the only ones from a single company that are larger in quantity than BEV.
Conclusion
What we currently see is that worldwide there are more than 200,000 pure electric vehicles, corresponding to a monthly amount of more than 10GWh. I believe that soon the monthly number of BEV vehicles globally will surpass 500,000 to 1 million, and the corresponding monthly demand will increase to 100GWh. From this perspective, it is impossible for a few battery companies to suppress the overall material demand. Think about how many battery companies will expand production capacity to fill this gap. Looking back at Figure 3, BEV monthly production in the US is currently at 30,000 vehicles and in Europe it is at 70-80,000 vehicles. When they reach 150-250,000 vehicles each (corresponding to a monthly production of 20GWh), the battery industry chain will indeed be able to establish itself nearby.
This article is a translation by ChatGPT of a Chinese report from 42HOW. If you have any questions about it, please email bd@42how.com.
