Author: Winslow
Tesla’s Q2 earnings report can be described as “flying low but safe”.
The company’s overall pre-tax net profit margin (including its automotive, solar, and after-sales service divisions) was 14.6% (down from last quarter’s 19.2%). The automotive division alone accounted for 86.2% of Tesla’s total revenue (down from 89.9% last quarter), with a pre-tax net profit margin of 15.8% (down from 21.8% last quarter).
The automotive division’s gross margin (excluding carbon offset credits) was 25.6% (down from 30.0% last quarter).
The company’s overall gross profit was 4.23 billion USD (down from last quarter’s 5.46 billion USD), with an operating net profit of 2.46 billion USD (down from 3.6 billion USD last quarter).
The company generated 620 million USD in free cash flow (down from 2.22 billion USD last quarter).
Overall, it’s clear that Tesla’s business metrics have declined across the board, making Q2 a quarter of “bad things” happening all at once.
The main factors contributing to this decline were:
(1) Lost production capacity due to the lockdown in Shanghai;
(2) The ramp-up processes at the super-factories in Texas and Berlin.
These factors, combined, had the following effects on Tesla’s operations:
(1) Significant reduction in vehicle deliveries, leading to lower revenue;
(2) Increased amortization and depreciation expenses per vehicle, leading to lower gross margin;
(3) Increased cash outflows due to inventory pre-purchases in response to the uncertain operating environment.
Below are updated charts showing long-term trends in specific business metrics.
Revenue, Selling Prices, and Gross Margin
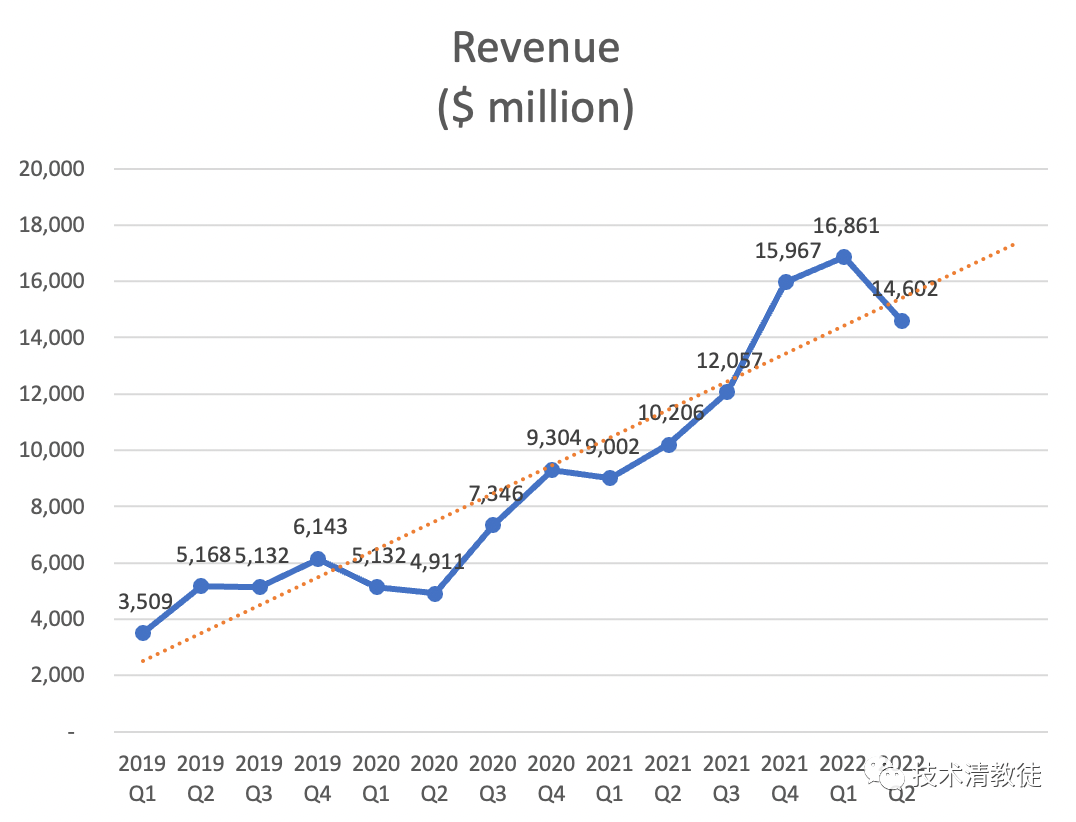
The significant reduction in vehicle deliveries led to a decrease in revenue.
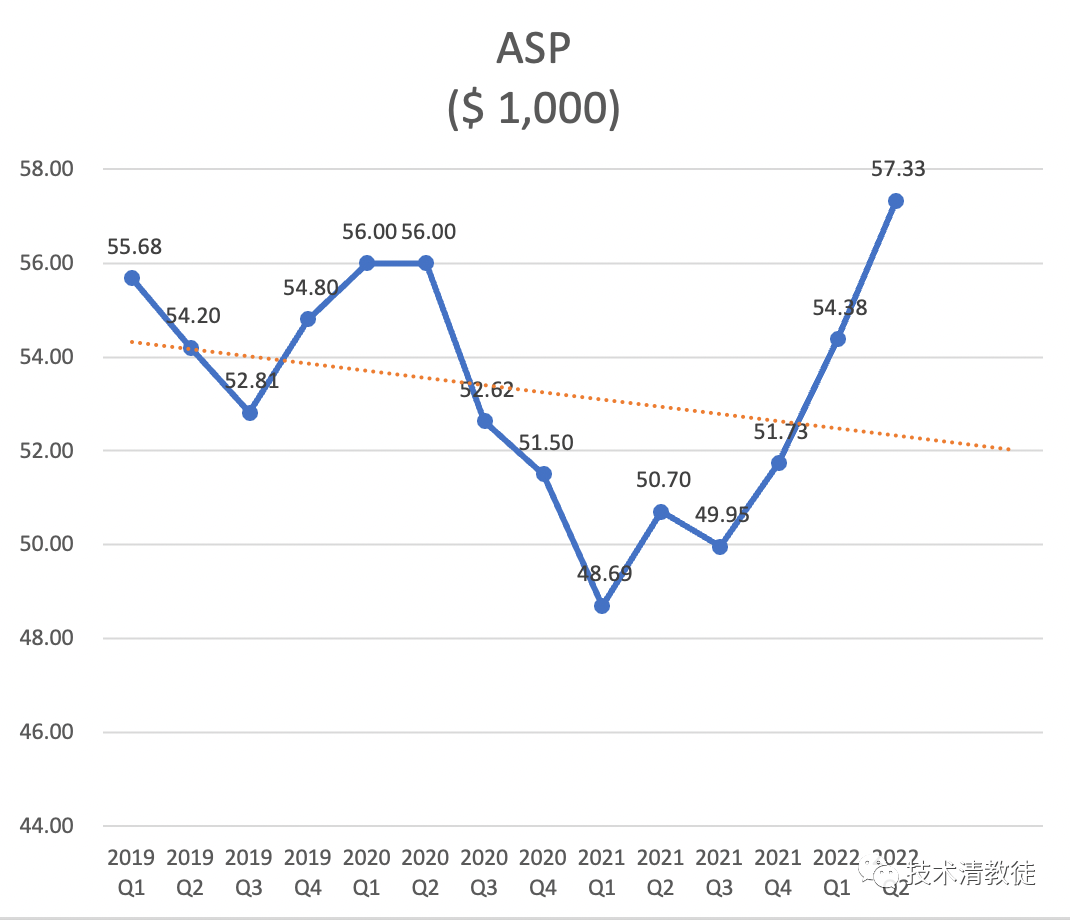
The average selling prices continued to rise due to price increases for individual vehicles between Q4 2021 and Q1 2022, as well as the continued ramp-up of high-value S/X products.
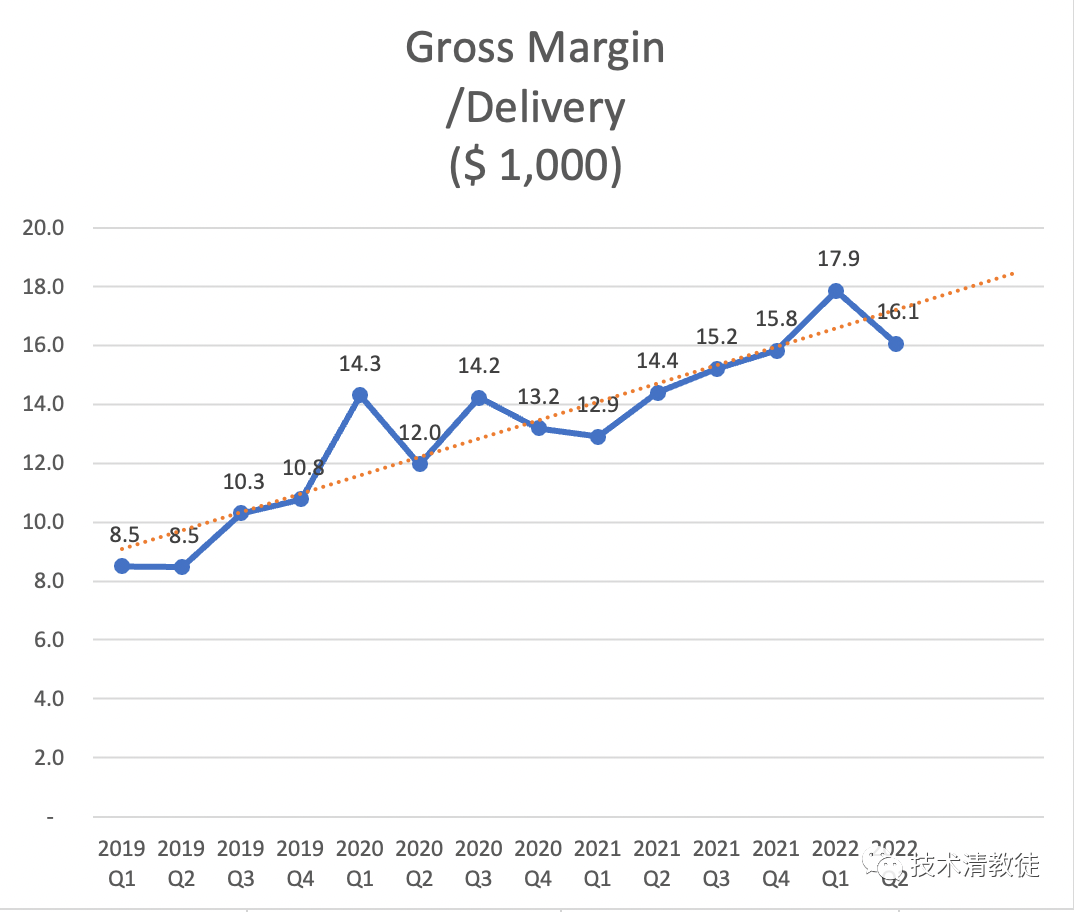
The decline in gross margins for individual vehicles was significant, not only in terms of a decline from the previous period, but also in relation to projected growth.
Operating Expenses
 ### Profit
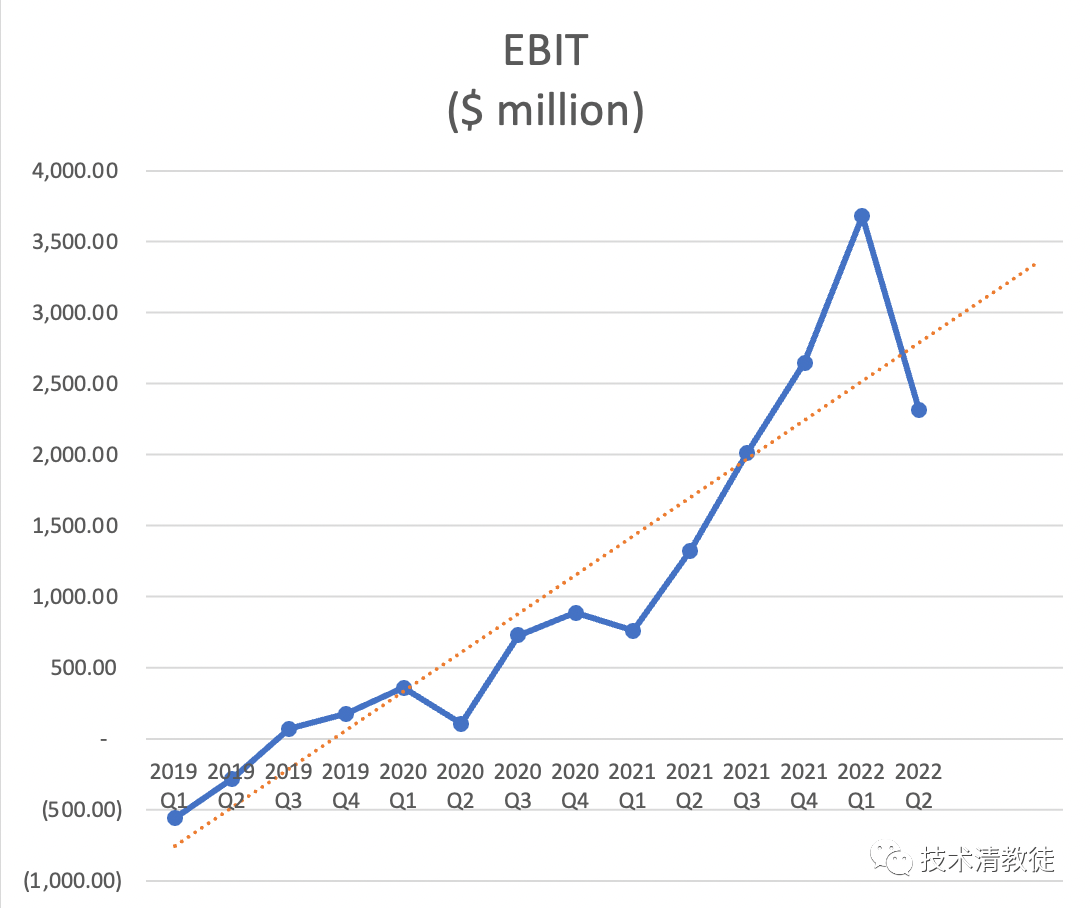
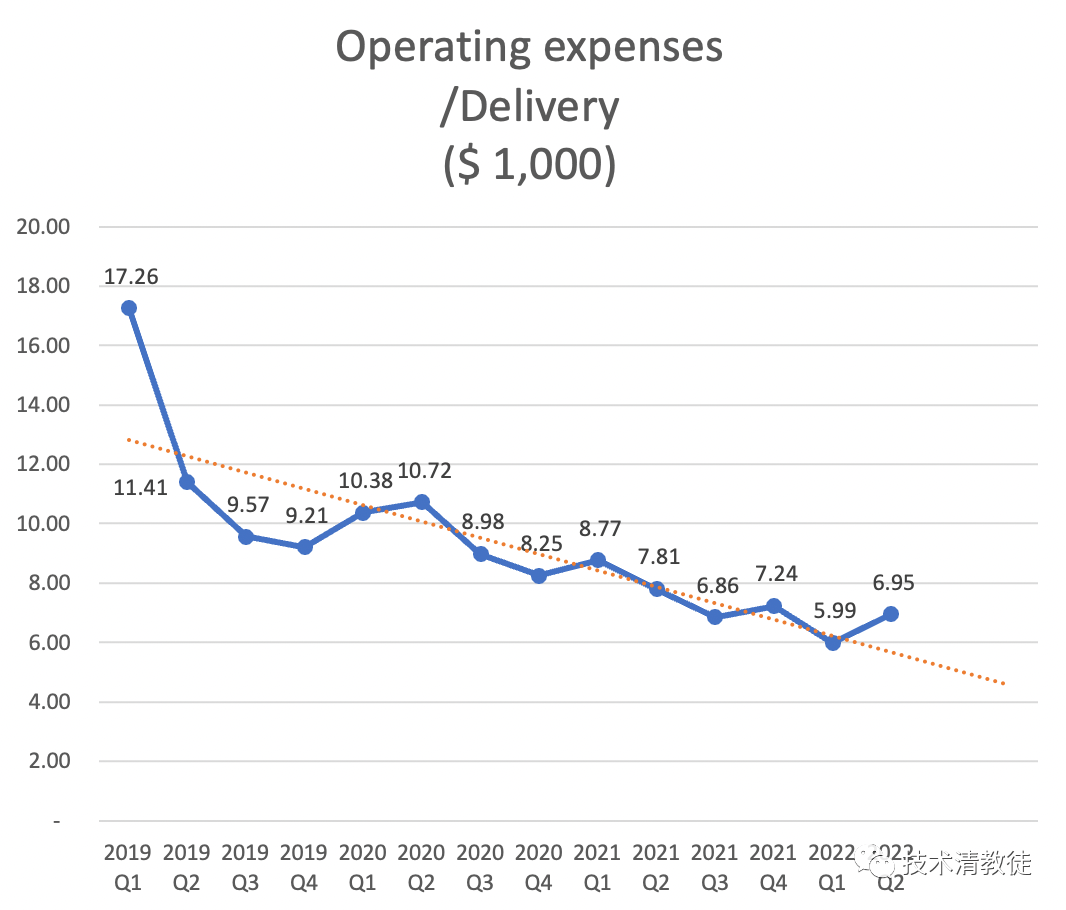
The shocking reversal of this profit before interest and taxes (PBIT) curve is mainly due to the decrease in gross profit caused by the combination of decreasing deliveries. Most of the operating expenses are fixed expenses that do not change no matter how many cars are delivered, such as office space rental expenses, employee salaries, etc. Therefore, the average effect of the number of deliveries greatly affects this section.
Production Asset Efficiency
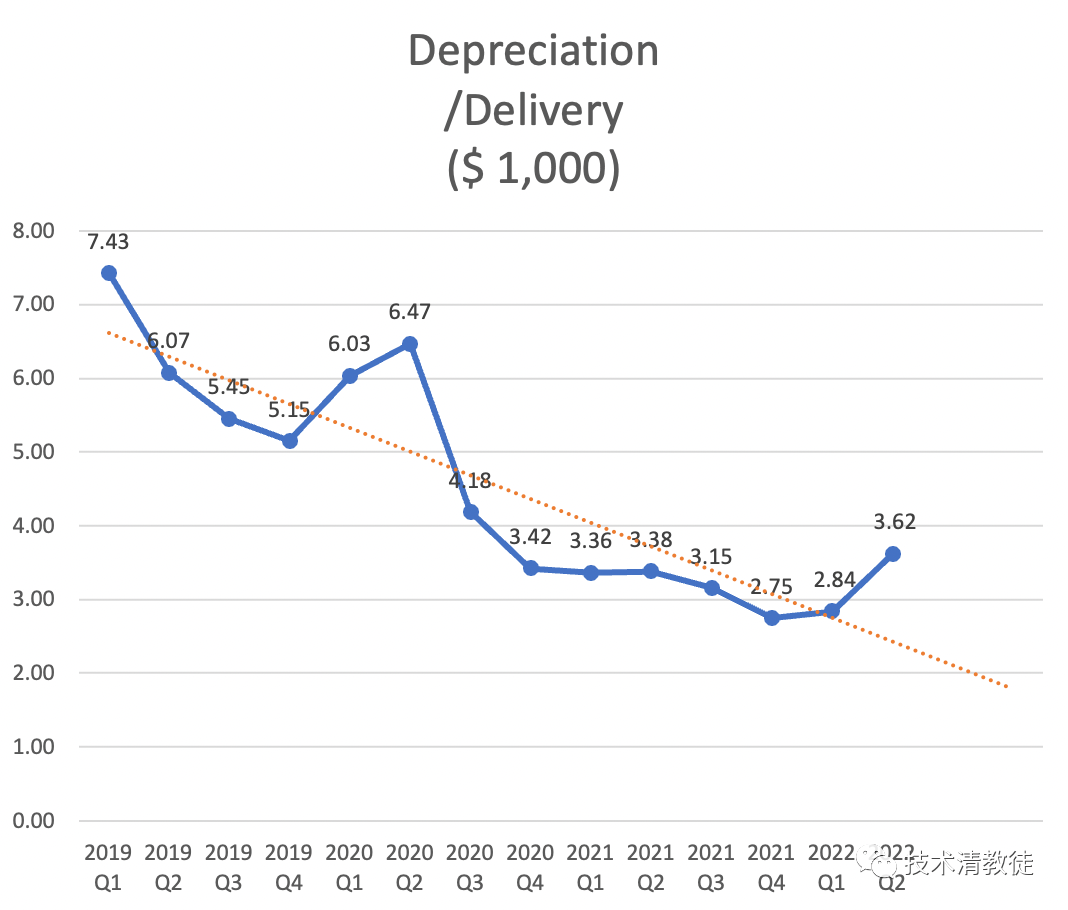
The depreciation and amortization per car, averaged out, rose from $2,750 in Q4 last year to $2,840 in Q1 this year, and then to $3,620 in Q2. This is mainly due to the suspension of production in Shanghai and the start of production in the Texas and Berlin gigafactories.
R&D Investment Intensity per Current Model
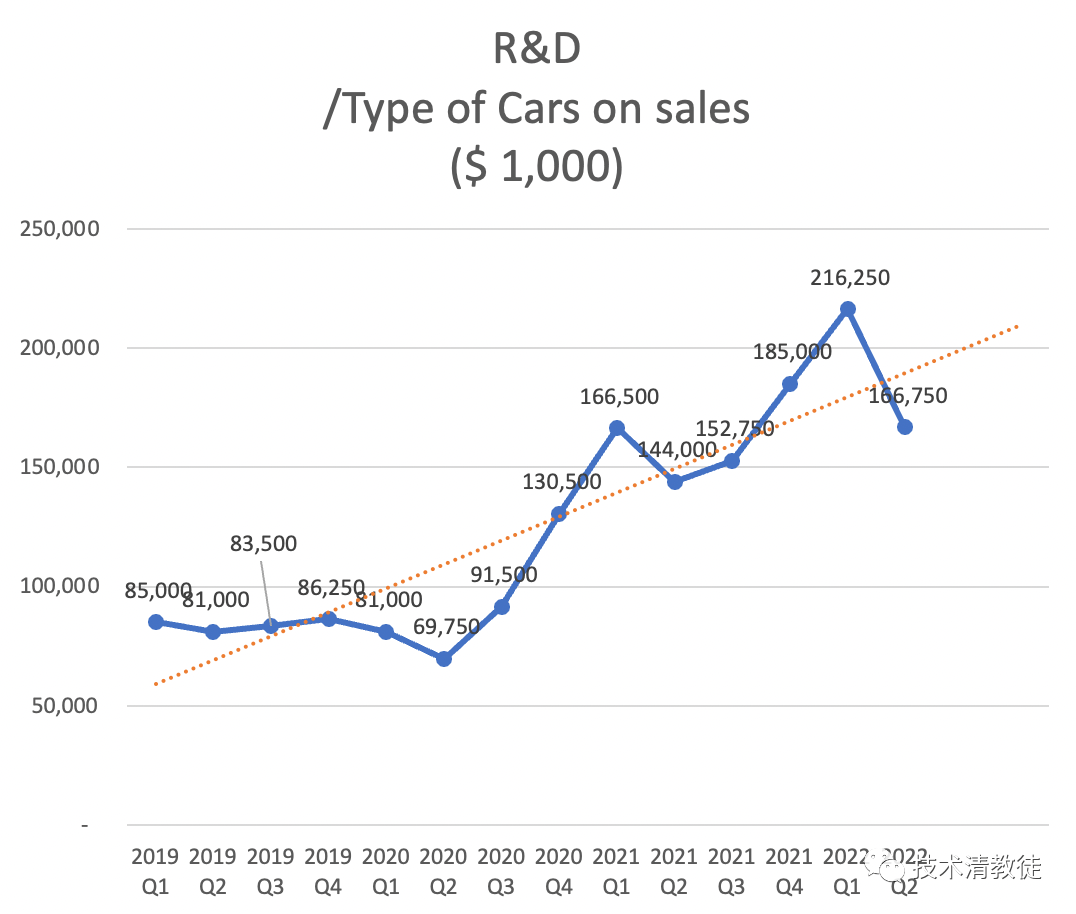
The R&D investment intensity per current model for Tesla is $160 million / Q2.
The Q2 operating data for Tesla may seem concerning, but it is important to examine the factors behind it, both those that are “repairable / have high elasticity / are highly certain” and those that are “unrepairable / have low elasticity / are uncertain.”
The Shanghai gigafactory’s production capacity is easily repairable and is expected to reach a monthly production of nearly 100,000 by the end of the year. The ramp of the Texas and Berlin gigafactories’ production capacity should have a high degree of elasticity and is expected to reach a monthly production of 20,000 by the end of the year. The certainty of demand for the product in China, the US, and Europe is high, with vehicles already being booked several months or even up to next year.
As the saying goes, “Tesla’s performance is like a close-to-the-ground flight, it may be astonishing, but it is not dangerous.”
This article is a translation by ChatGPT of a Chinese report from 42HOW. If you have any questions about it, please email bd@42how.com.
