Author: Zhu Yulong
After completing level A00, we can see that 2022 is still quite different. The retail sales of new energy passenger cars in the first five months reached 1.59 million, and with the expected 438,000 in June, the sales in the first half of the year exceeded 2 million (which is still quite fast compared to 1.047 million last year). Let’s take a look at the classification:
-
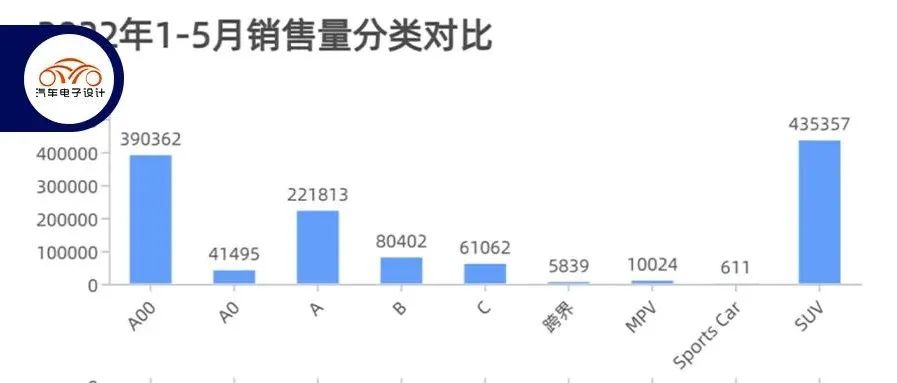
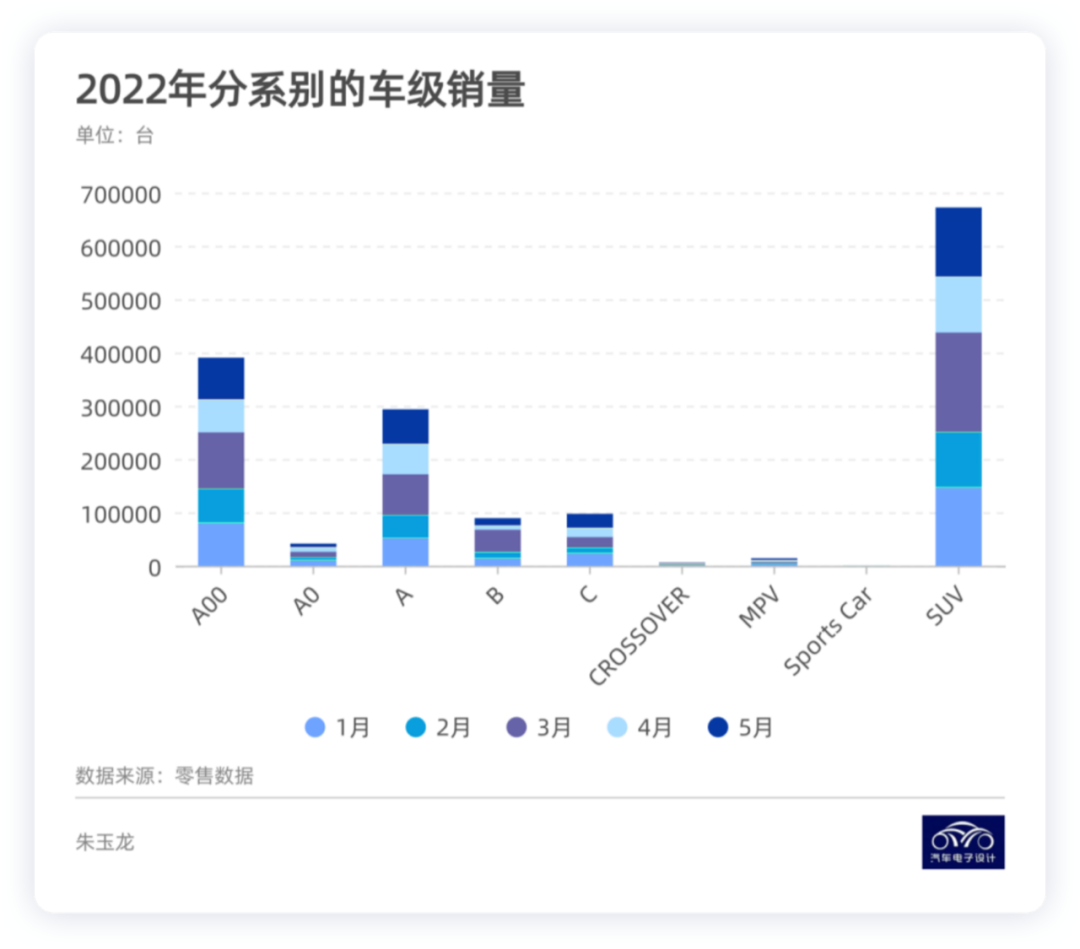
A00 market sales volume is 390,000, accounting for 24%, which is significantly lower.
-
SUV sales are 670,000, accounting for 42%, which has risen fast.
-
A-class car sales ranked third with 290,000, accounting for 18%, which is quite surprising and higher than the approximately 90,000 and 97,000 for B-class and C-class respectively.
However, the performance of A0 class and niche markets is not satisfactory, which I think objectively reflects the changes in the new energy vehicle market under the dual effects of rising oil prices and batteries.
-
The pressure of rising battery prices is enormous for A00 and A0 classes. On the one hand, the rising price has made consumers hesitant to buy this type of car, and on the other hand, the losses from producing these small cars are increasing. Therefore, supply will also contract.
-
In the SUV and A-class categories, the proportion of PHEVs is increasing. Originally, B-class and C-class electric cars were already quite expensive, and continuous price increases have a significant impact on consumers’ psychology.
-
In the SUV insurance data, the ratio of BEVs to PHEVs is now 2:1, which is surprising.
Pure electric vehicles reached 1.2469 million in the first five months of 2022, which is significantly higher than 0.3432 million for plug-in hybrids in terms of sales volume. However, if we consider it by series, as shown in the figure below, except for A00 and A0 that do not have many PHEVs, the demand growth rate of plug-in hybrids is still higher than that of BEVs.
-
SUV pure electric vehicles are 0.4353 million, and PHEVs are 0.2224 million, and this ratio is gradually changing.
-
C-class pure electric vehicles are 0.061 million, and plug-in hybrids (PHEVs) are 0.0363 million.
-
A-class pure electric vehicles are 0.2218 million, and plug-in hybrids (PHEVs) are 0.0717 million.
This data proves that the pattern of plug-in hybrids and pure electric vehicles has begun to reverse in multiple segmented markets, and this type of car absorbs traditional fuel car owners to switch to new energy vehicles under the current oil price.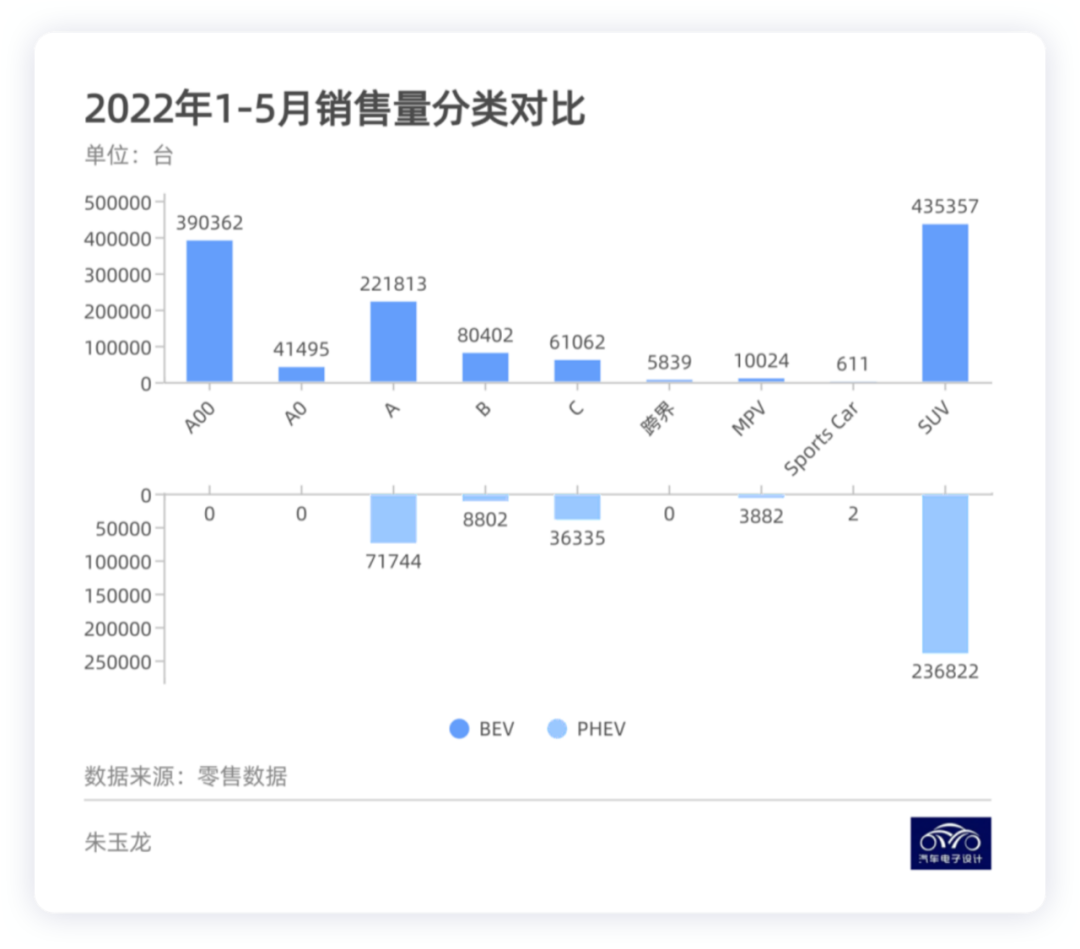
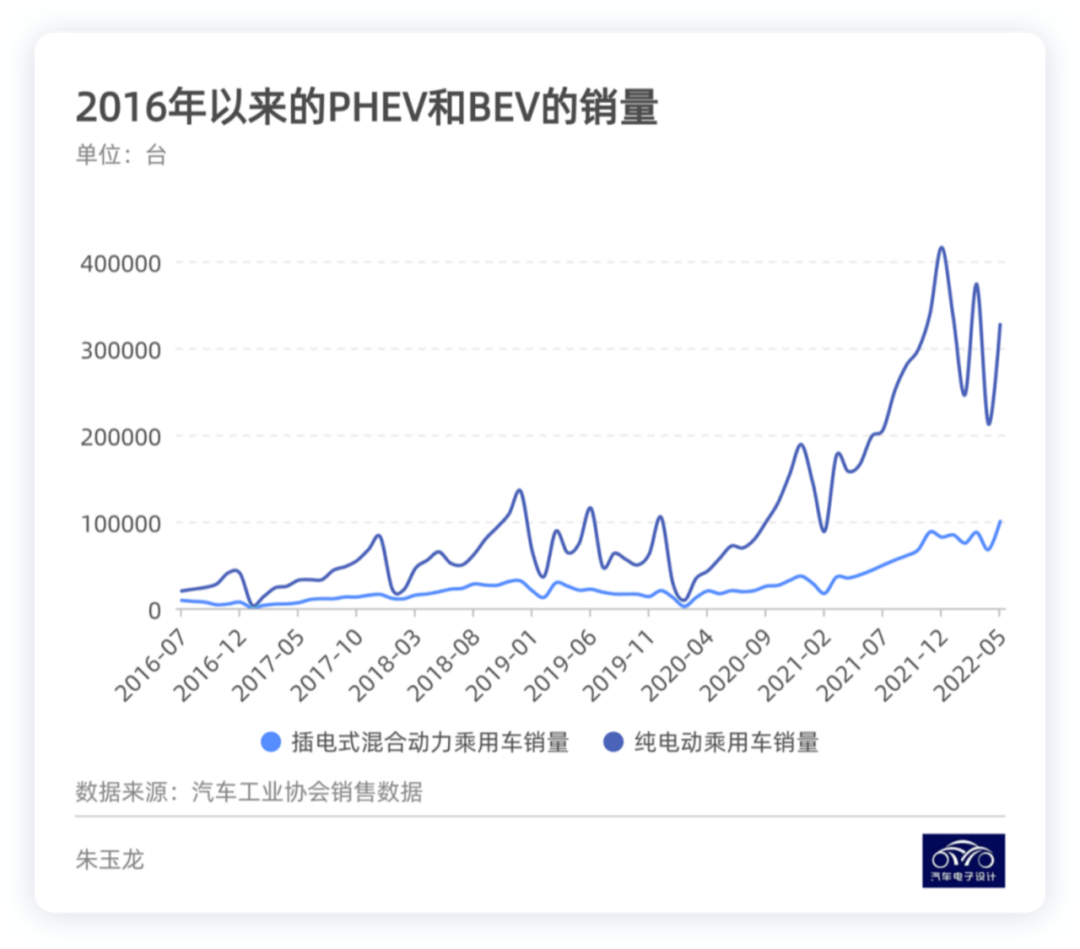
Due to forward-looking indicators, the data from insurance companies may be conservative. If we use the sales data from the Automobile Industry Association (which should include 168,000 exports), the sales figures for January to May 2022 were 1.915 million, much higher than the 1.59 million figures from insurance companies (a difference of 157,000).
- Sales of BEVs reached 1.5 million, a year-on-year growth of 102%.
- Sales of PHEVs reached 414,000, a year-on-year growth of 167%.
This data is still in the early stage of many enterprises promoting DHT plug-in hybrids. From a long-term perspective, with consideration of practicality in China, the proportion of pure electric cars and plug-in hybrids may have a substantial change in 2023, as the country transitions to a more market-oriented approach and cancels subsidies for new energy vehicles.
The growth potential of PHEVs
I will examine the growth potential of PHEVs from two dimensions, one being the brand and classification of PHEVs participating in the market. The major participants in the plug-in hybrid market are shifting from foreign-invested enterprises to Chinese automakers, including BYD, Ideal, and Sylphy.
-
BYD had accumulated sales of 214,710 in 2022, accounting for 60.04% of the market share, which is really surprising considering the popularity of the DM-i series.
-
Ideal Cars had accumulated sales of 47,649 in 2022, accounting for 13.33% of the market share.
-
Sylphy had accumulated sales of 11,710 in 2022, and the market share is rapidly increasing, accounting for 3.27%.
-
Volkswagen had accumulated sales of 12,047, accounting for 3.37% of the market share.
-
Other brands include Lynk&Co (9,522 units), BMW (8,545 units), and Mercedes-Benz (8,745 units).
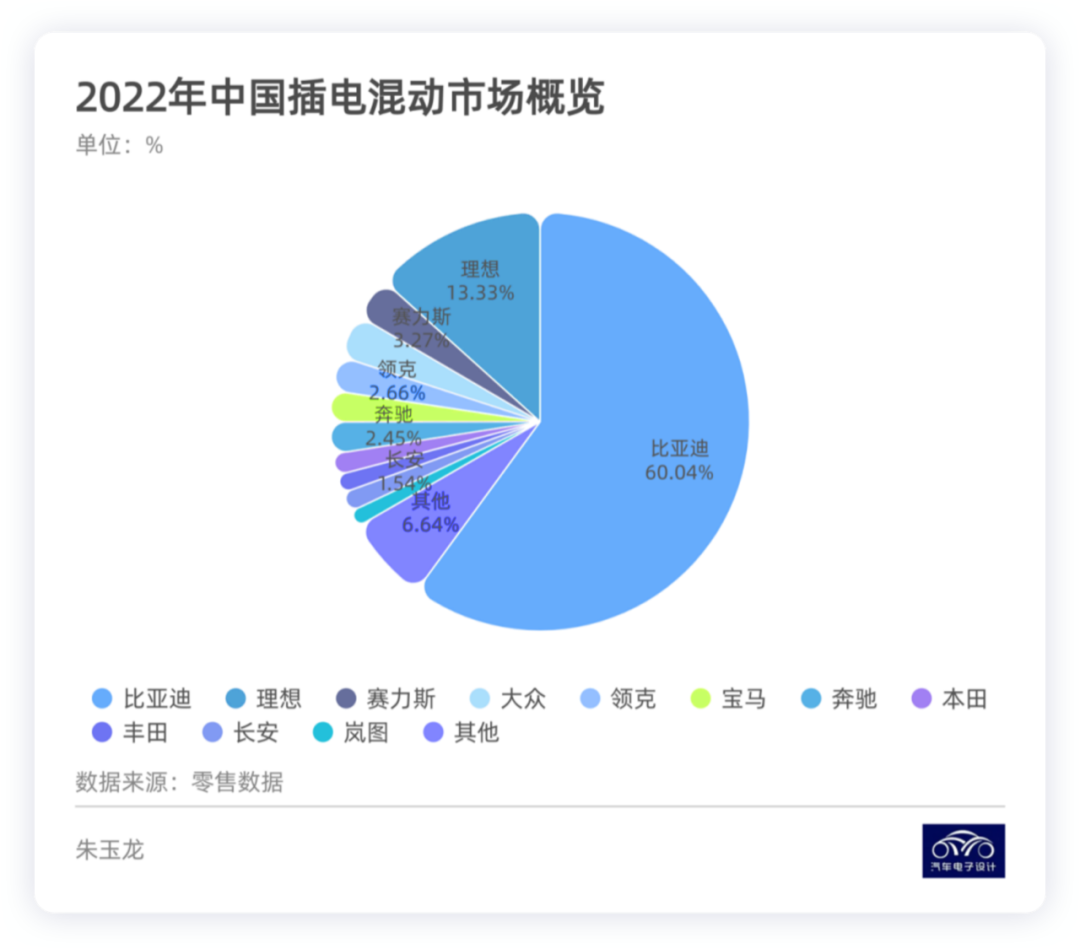 From the current incremental figures, the deliveries of BYD’s plug-in hybrid vehicles keep rising, and the follow-up deliveries of Ideal’s L9 will also see further breakthroughs in data. Additionally, with the expected breakthrough of 5000 units by Sylphy in June, I think plug-in hybrid vehicles from Lynk & Co and Changan are also worth paying attention to. As domestic independent brands advance their DHT product line, the sales volume is expected to increase significantly. The new plug-in hybrid electric vehicles from Great Wall Motor and Chery are also impressive.
Once a strategy centered around non-limit license plate cities is established, plug-in hybrids will reach 100,000 units in China Association of Automobile Manufacturers’ data. As the supply of BYD’s DM-i significantly increases, it is highly probable for them to deliver 200,000 units per month this year, which means that according to the new climb curve, the sales volume in the first half of this year would be 510,000 units, and in the second half 600,000-800,000 units. Therefore, the sales volume of plug-in hybrids is highly likely to exceed 1.1 million, estimated to be around 1.2-1.3 million.
The main reason is that the growth is mainly determined by the release of production capacity and has low dependence on the sales region. Furthermore, due to the low battery capacity, its impact isn’t very significant in this wave of battery cost changes. Currently, I will conduct separate research on the battery market and explore if battery companies in this specific segment can make profits.
As for the white-hot competition in the pure electric market, we should analyze the situation without considering categories such as A00, A0, A, B, and C. Due to limited space, let’s focus on the A-class pure electric cars. Since charting several months of data takes too much time, let’s analyze May data for now. In my personal opinion, it will be difficult for most companies to make significant breakthroughs in the second half of the year in the A-class pure electric vehicle market. There are several reasons:
- As we’ve analyzed earlier, reaching the total target of A00 is possible.
- Battery costs make only BYD still playing in the A0 level. As for A-class cars, most people are quite restrained in terms of overall incremental volume, and prices are starting to range around 150,000-200,000 USD.- The prominent situation this year is that the traditional markets of Tesla and BYD, namely B and C, began to diverge. I’m looking forward to seeing Chinese automakers produce more models that compete with the Model 3.
We will analyze this area more carefully next week.
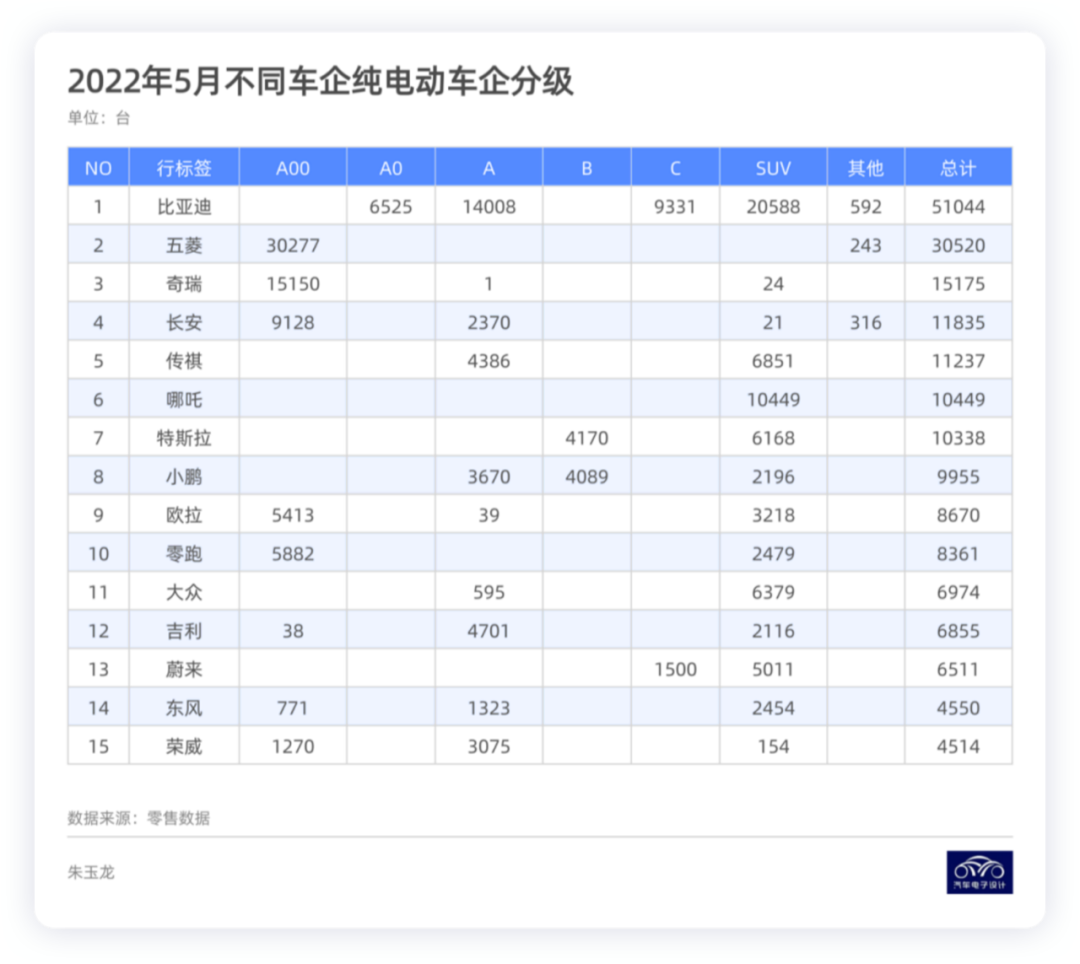
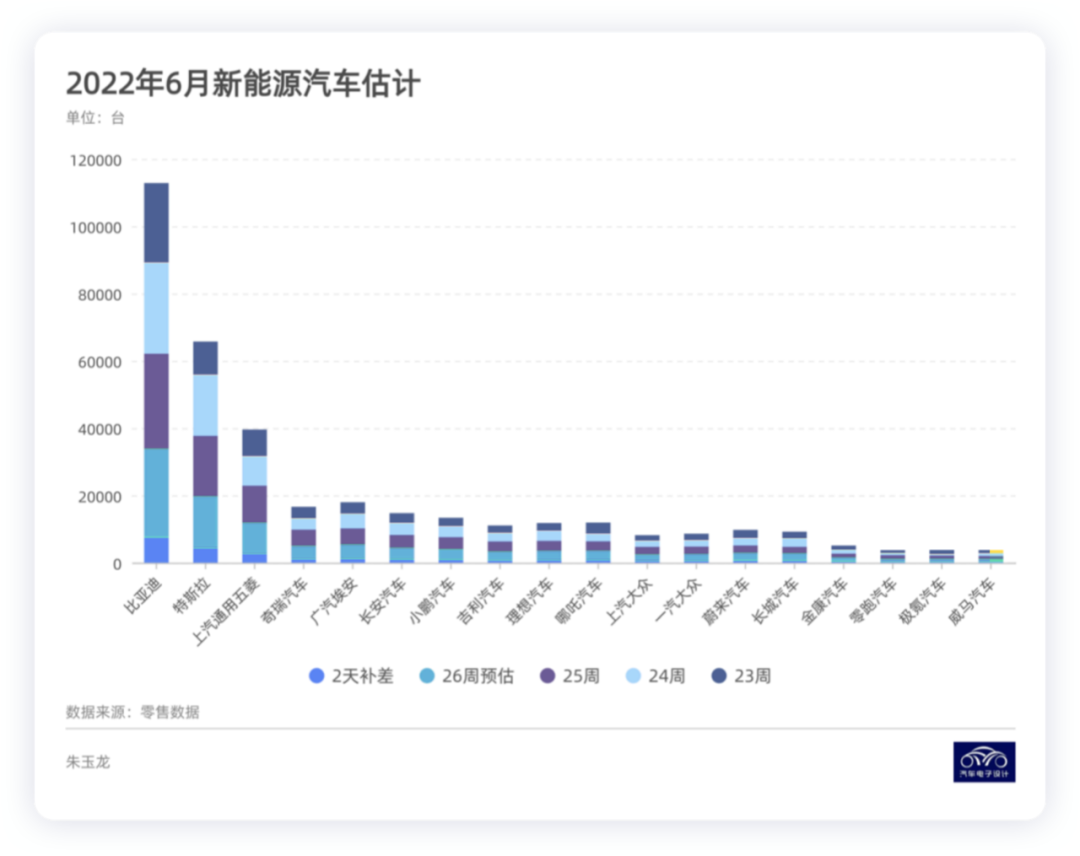
Based on data from June, I roughly estimated this data. You can refer to it.
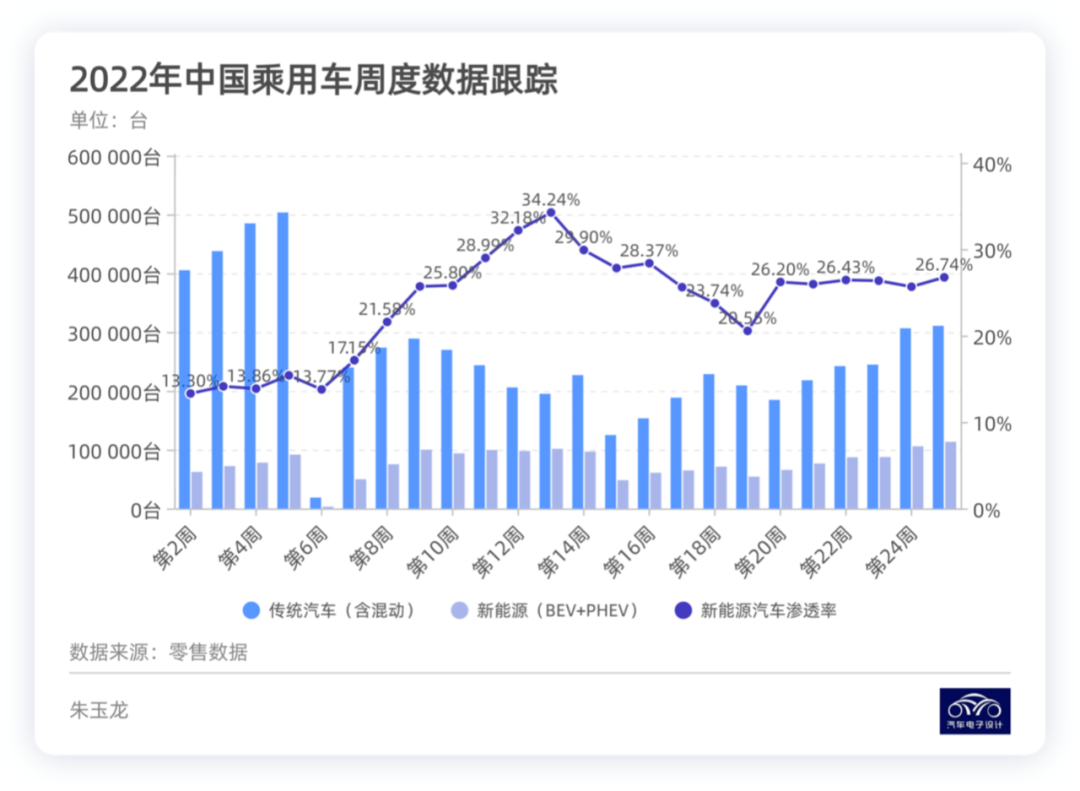
The current penetration rate is at a certain level. From a practical point of view, breaking through higher levels may seem relatively simple, but this is influenced by battery prices and macroeconomics.
Conclusion: Creating this weekly graphical interpretation is particularly challenging, but it is also very useful to facilitate everyone’s visualization. I hope that everyone can support my two weekly articles that cover these descriptions, which will make it easier and clearer for you to understand the industry’s development. I made these graphics myself, which took me many hours. I did my best to make them understandable for everyone.
This article is a translation by ChatGPT of a Chinese report from 42HOW. If you have any questions about it, please email bd@42how.com.
