Author: Winslow
Tesla’s Q1 financial report, released early in the morning, can be summed up in one sentence: Unafraid of inflation, Tesla has demonstrated its ability to increase profits at a multiplier effect level.
The pre-tax net profit margin of Tesla’s overall business (including the automotive, solar, and aftersales service sectors) has increased to 19.2% (compared to 14.7% in the previous quarter).
The automotive sector alone accounts for 89.9% of Tesla’s total revenue (compared to 84.8% in the previous quarter). At the same time, the pre-tax net profit margin of the automotive sector has increased to 21.8% (compared to 16.6% in the previous quarter).
The gross profit margin of the automotive sector (excluding carbon credits) has steadily increased to 30.0% (compared to 29.1% in the previous quarter).
The company’s overall gross profit has reached 5.46 billion (compared to 4.85 billion in the previous quarter), and net profit has reached 3.6 billion (compared to 2.61 billion in the previous quarter).
Free cash flow was 22.2 billion (compared to 27.7 billion in the previous quarter), mainly due to debt repayment.
Revenue, Price, and Gross Margin
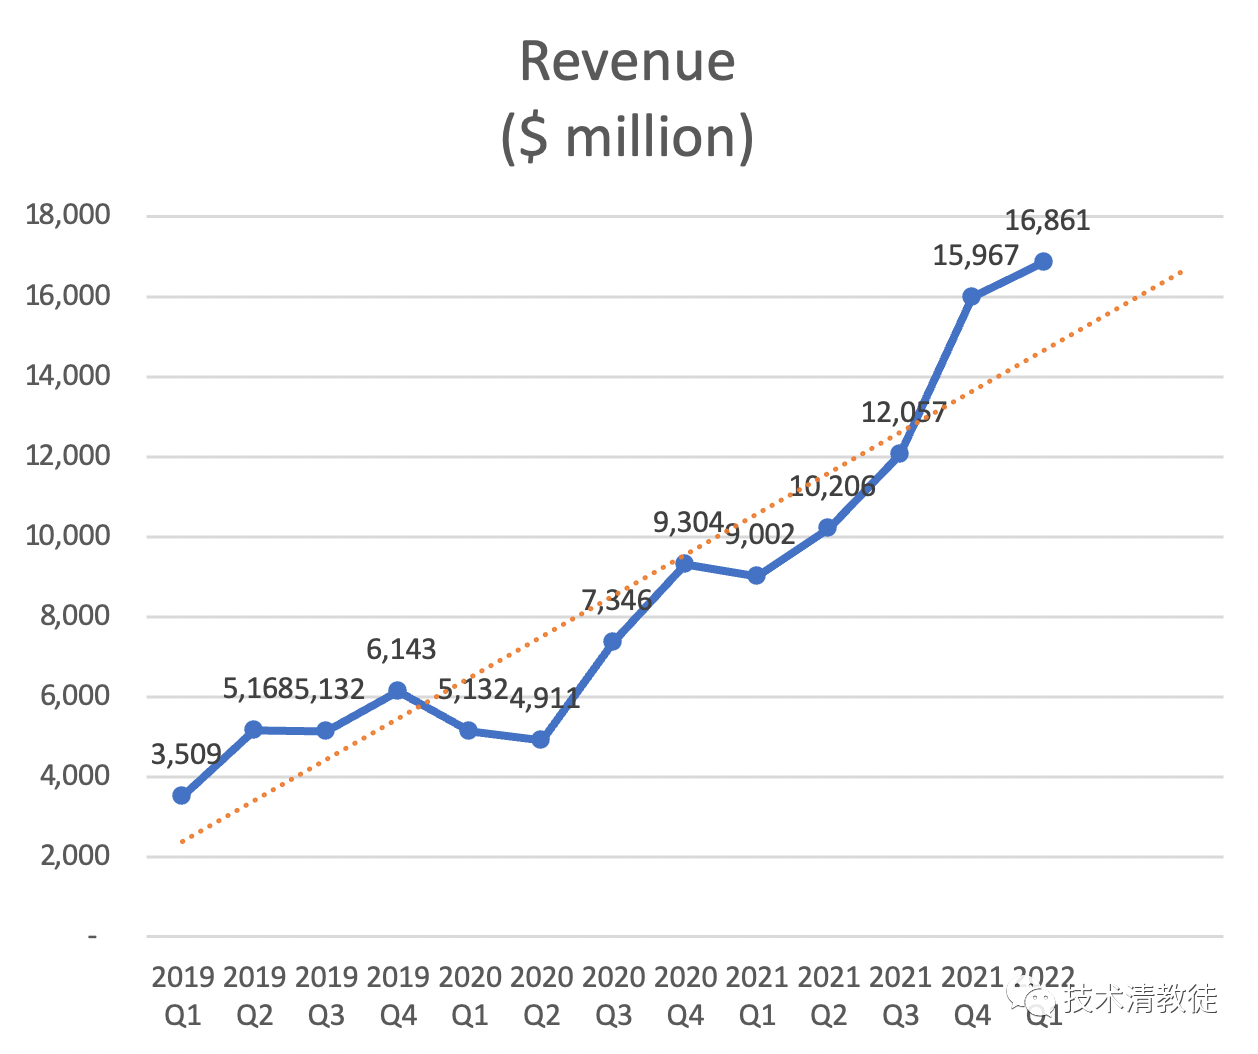
In previous years, first-quarter revenue was typically lower than fourth-quarter revenue, but this year has continued to set new records, likely due to the combined effect of record-high delivery numbers, timing differences in price increases, and a continued increase in delivery of high-value S/X products.
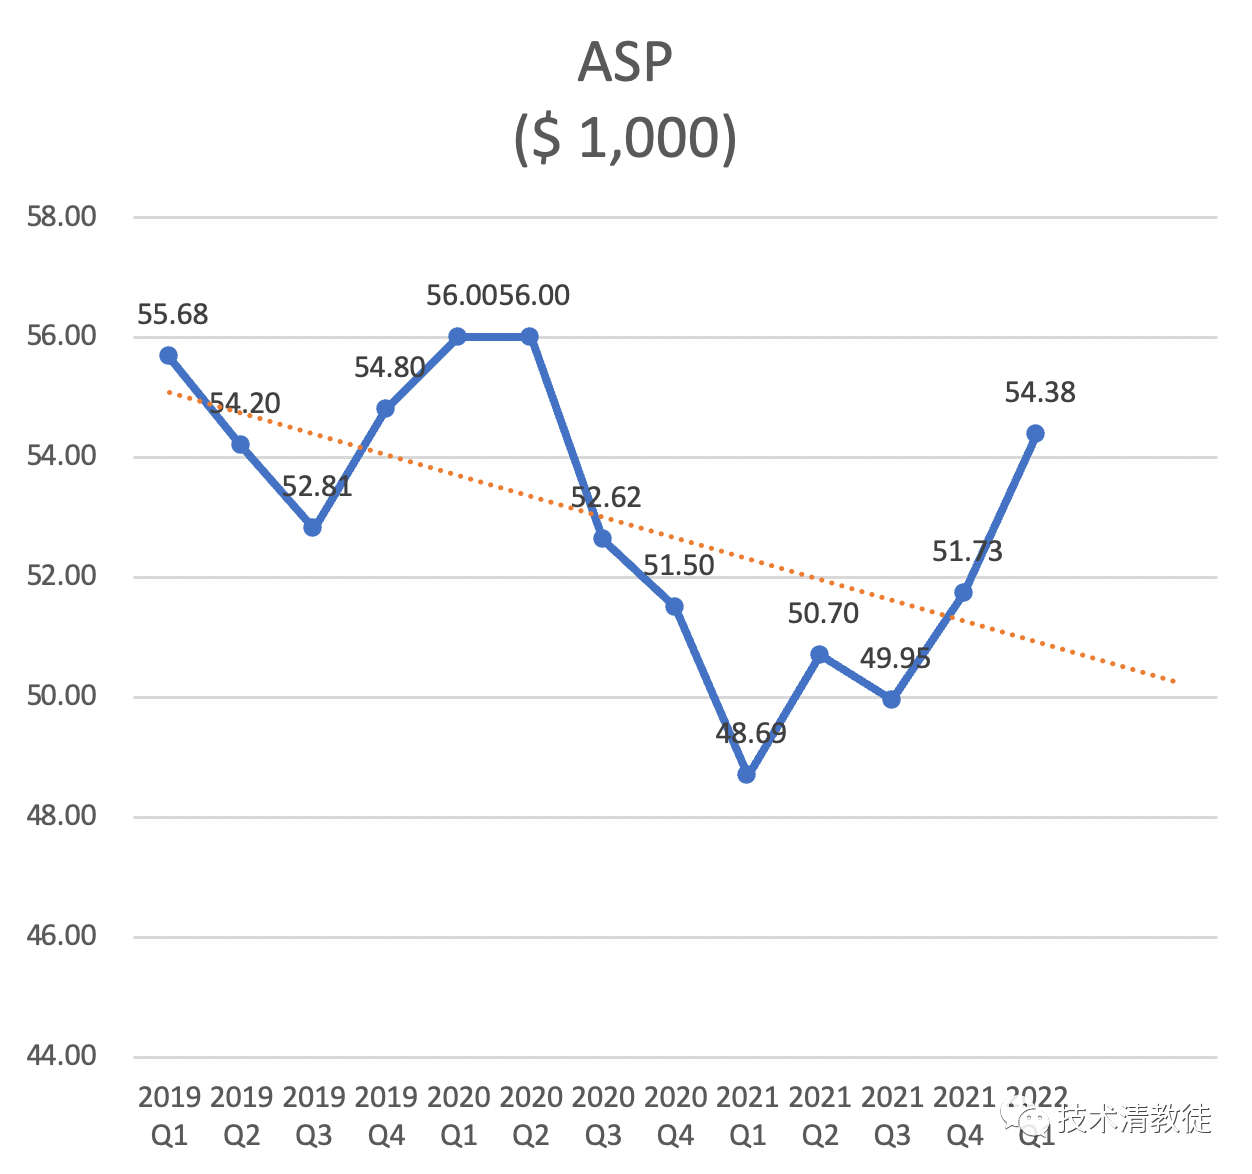
The average selling price per vehicle in Q1 was 26,500 USD higher than in Q4 last year, mainly due to multiple price increases for Model 3/Y and an increase in delivery of new S/X.
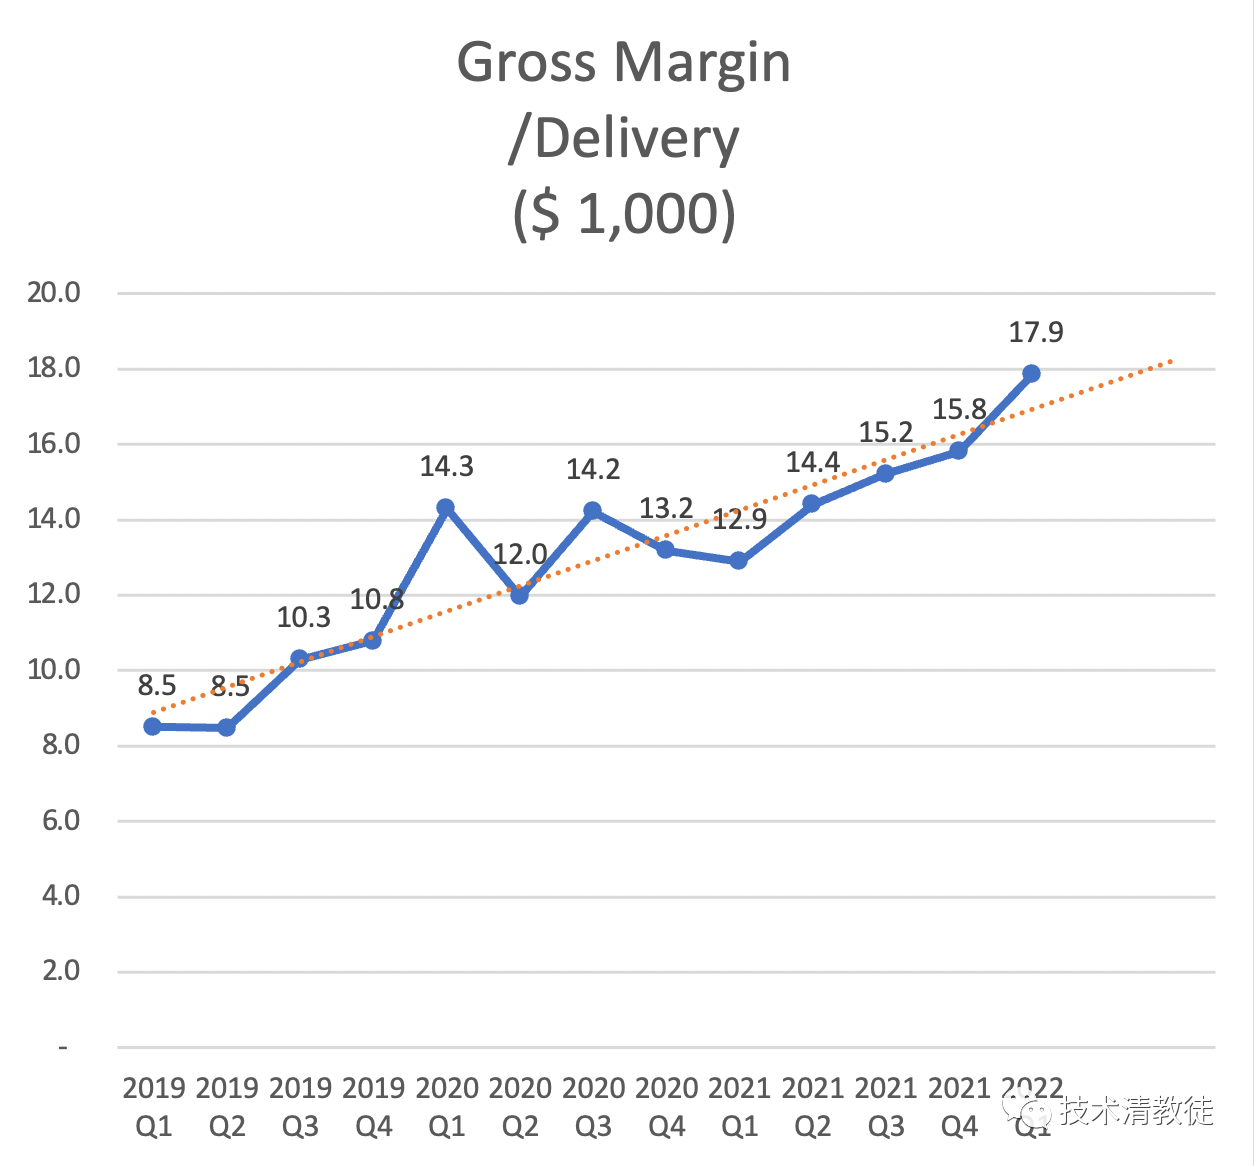
The gross margin per vehicle has also reached a new high.
Operating Expenses
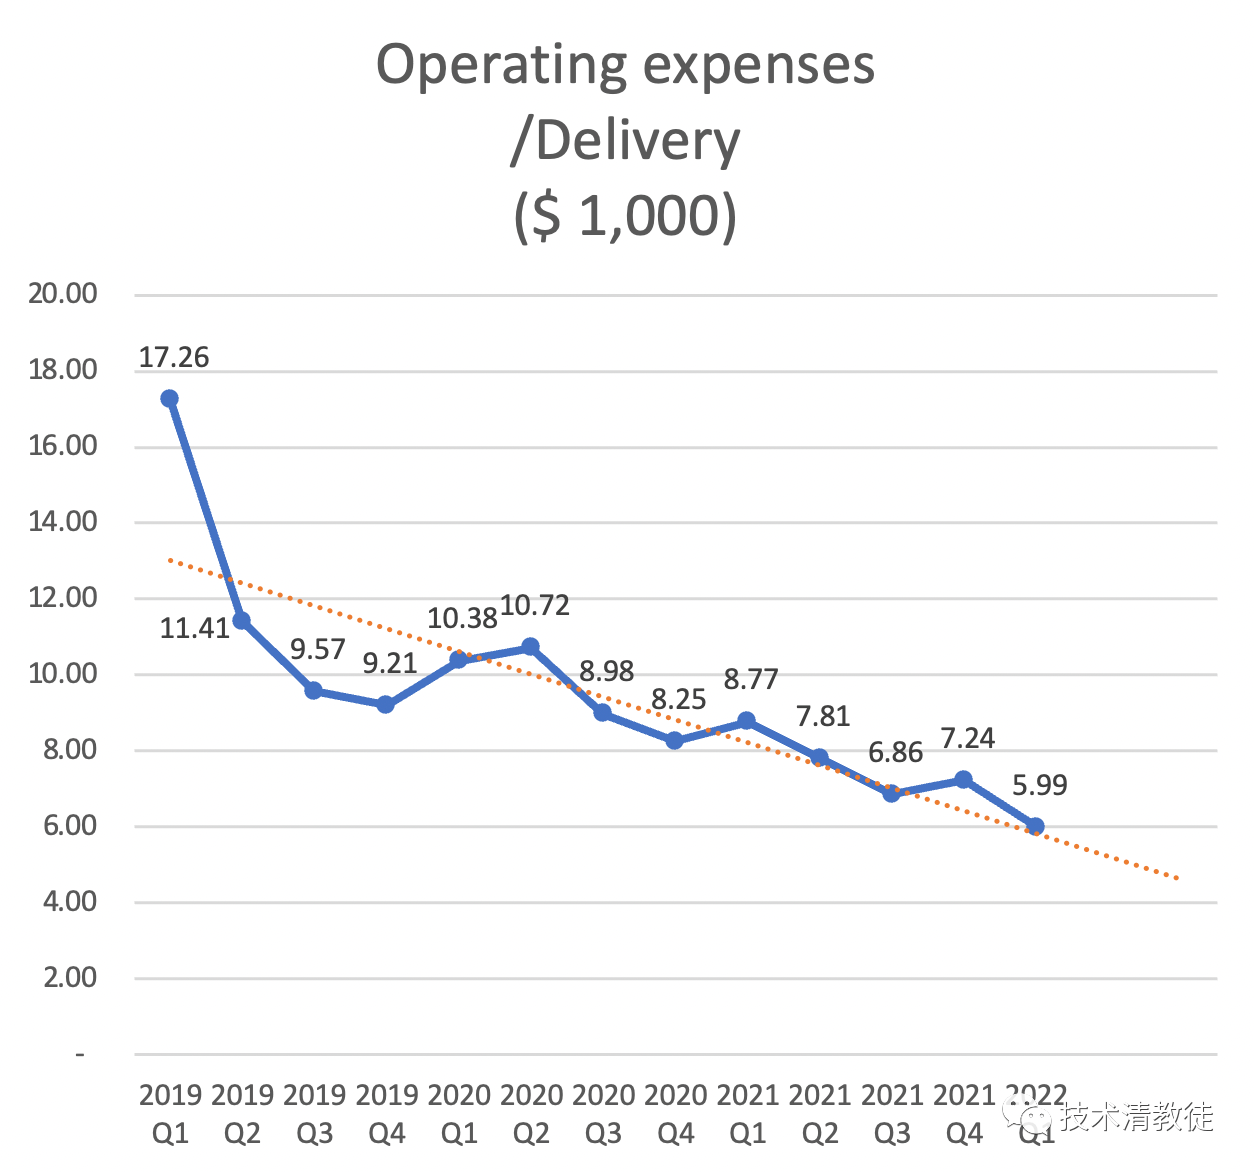
The unexpected increase in operating expenses in Q4 last year was mainly due to a one-time stock-based compensation expense for Elon Musk. Q1 operating expenses continued to decrease significantly. Elon Musk believes that operating expenses are still too high and expects them to continue to decline on a per-vehicle basis in the future.
Profit
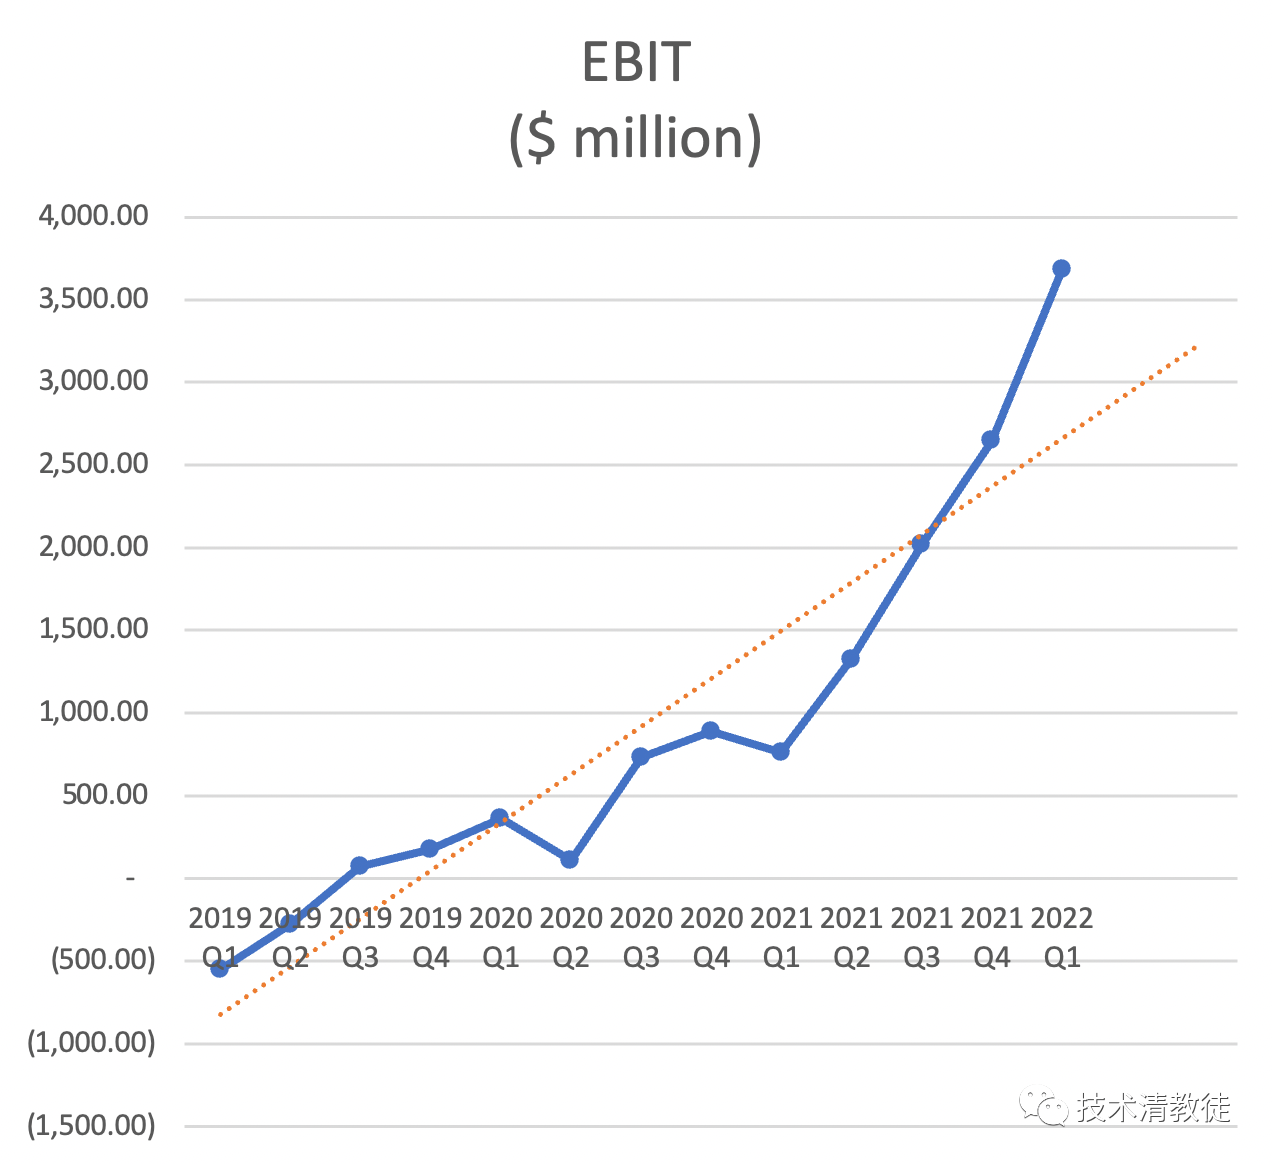 With short-term ASP and gross margin growth, coupled with continued decline in operating expenses, the EBIT curve is expected to remain steep in the future.
Manufacturing Asset Efficiency
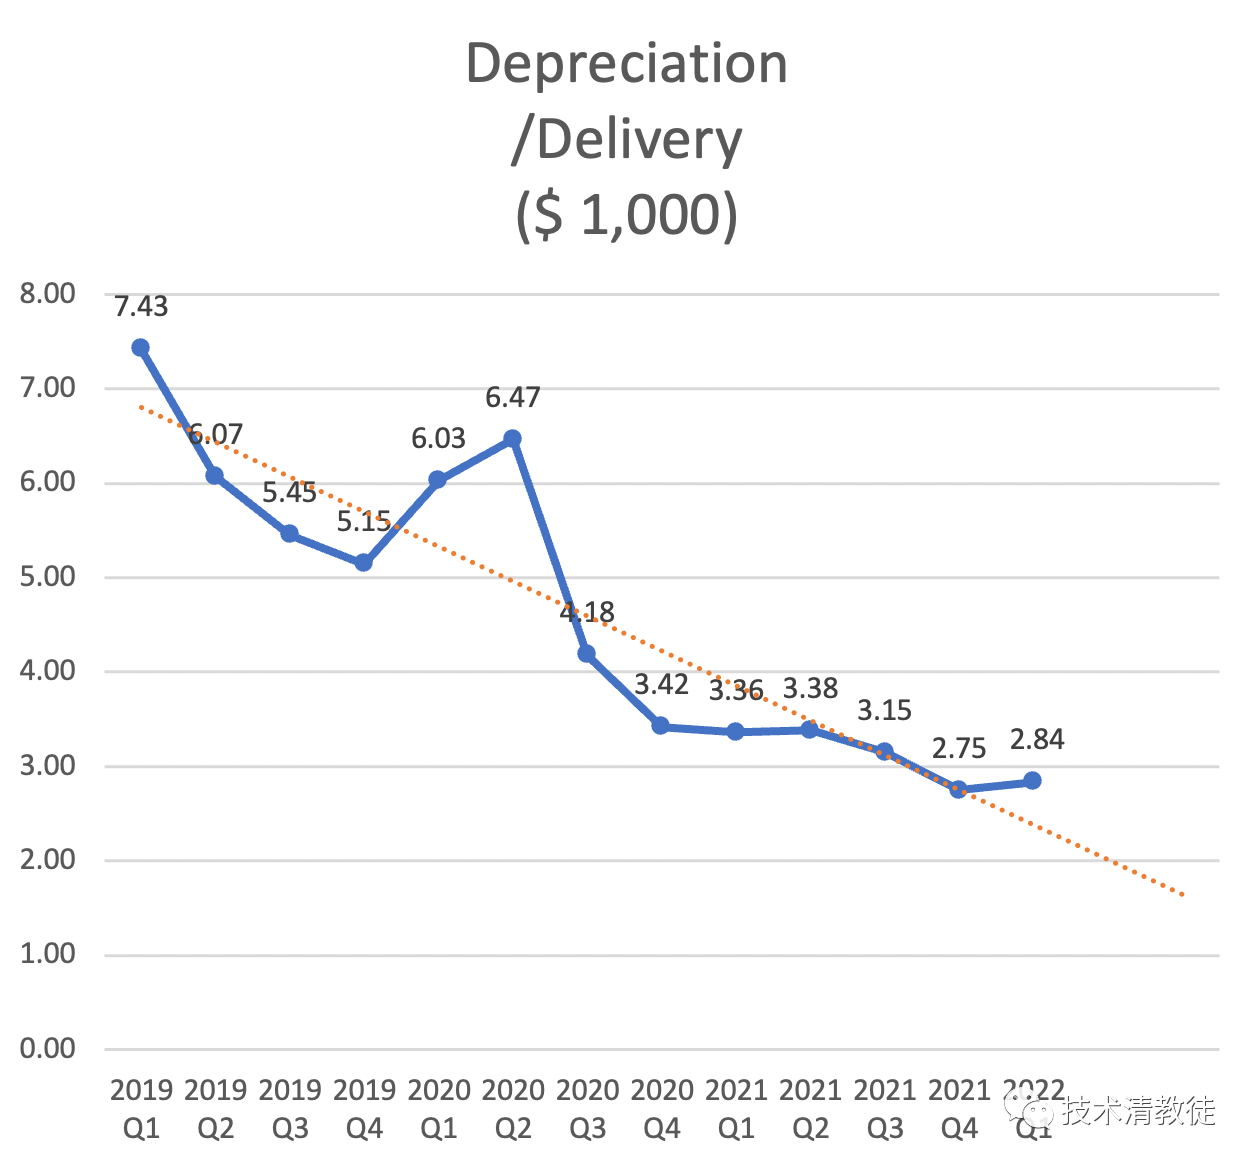
The depreciation and amortization per car has risen from $2,750 in Q4 of last year to $2,840. This is mainly due to the Texas and Berlin super factories being put into use and beginning to be included in depreciation. As these two factories continue to produce, the average depreciation per car should continue to decrease.
Manufacturing Asset Efficiency
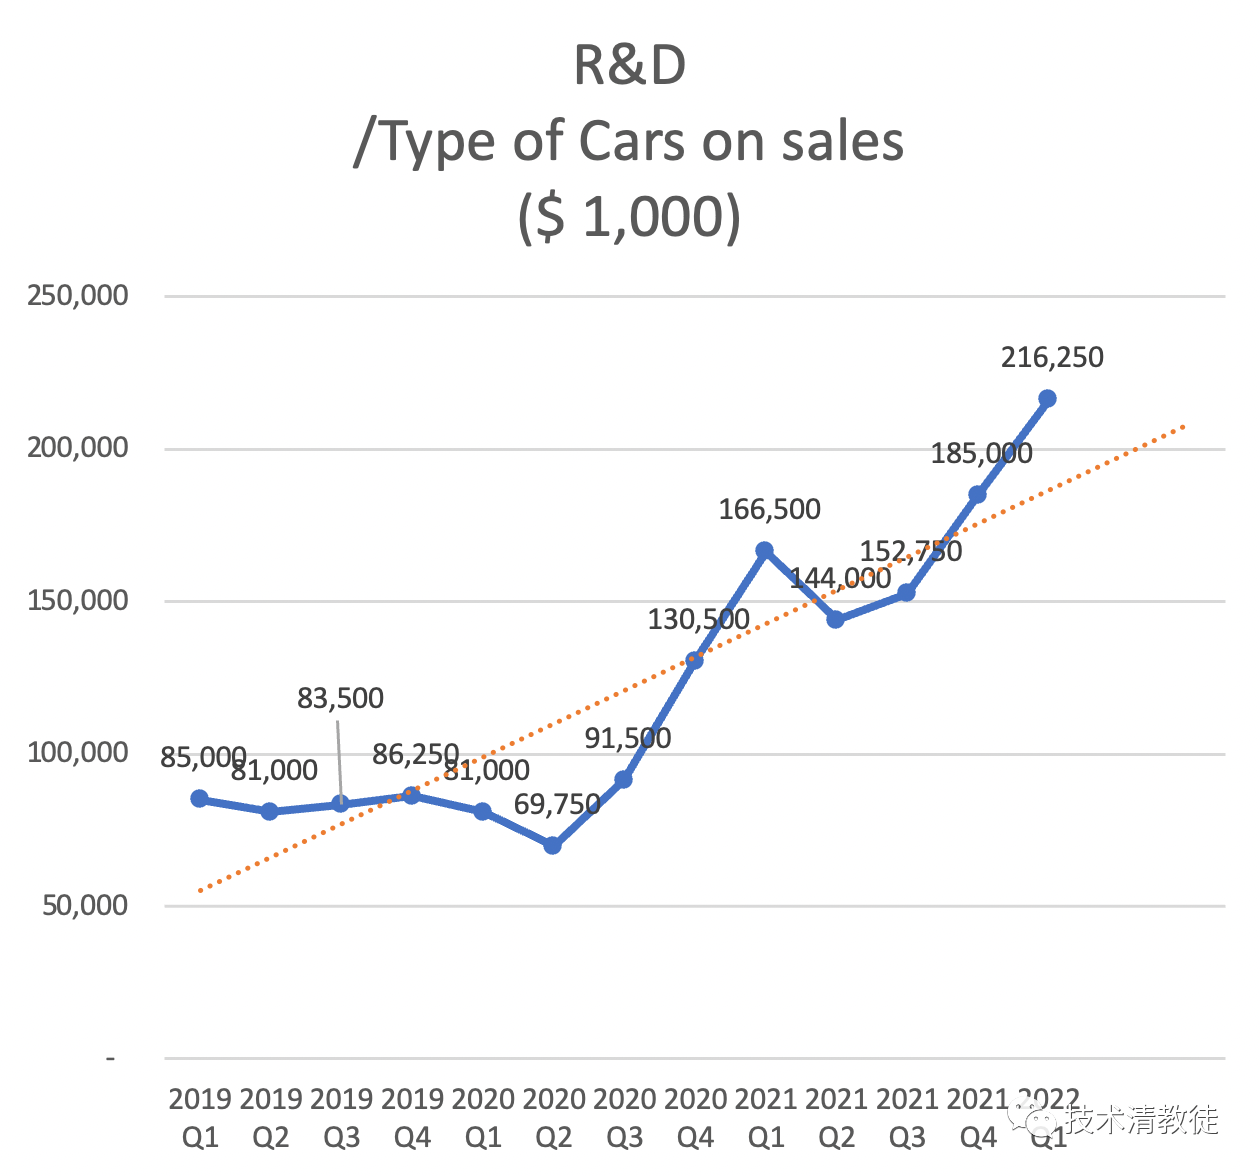
Going forward, adding R&D expenses as a reference dimension to calculate input intensity by averaging the R&D expenses of each car model. We do not include R&D expenses for in-development car models as information in this area is not transparent and could potentially cause inaccuracies in calculations.
Overall, Tesla’s Q1 financial report is most impressive in terms of continuously optimizing gross margin and average operating expenses. Especially the rapid decline in average operating expenses, the gap between the two continues to widen, and this is the key to the rapid increase in Q1 net profit.
In the continuing inflation, companies with terminal pricing power often have the opportunity to expand their advantage over competitors. Because as long as the ASP rises and gross margin can be maintained, the actual profitability of the company will increase. If during this period the gross margin can rise against the trend, there will be a level of profit increase ability of multiplication effect. Currently, Tesla seems to belong to the latter.
This article is a translation by ChatGPT of a Chinese report from 42HOW. If you have any questions about it, please email bd@42how.com.
