Overview of European Energy Status
The recent changes in international political situation have fully exposed the long-standing energy security issues in Europe.
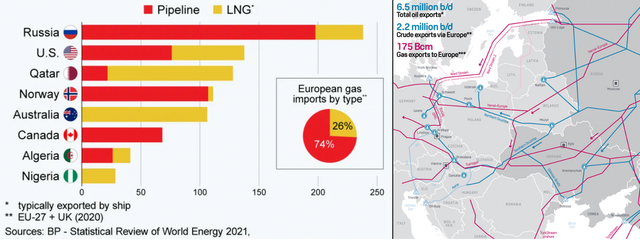
Europe has been relying on imports for traditional energy, with natural gas imports from Russia accounting for about 45% of the total imports, and oil imports from Russia accounting for about 27%. Ensuring a secure and stable supply of energy and electricity and reducing the high energy prices has become a problem that Europe must consider. Starting from 2022, the development of new energy vehicles in Europe may further accelerate, which is directly related to solving the problem of energy and end-use.
Note: Currently, Europe has a feeling of desperate and impulsive search for solutions.
Recently, the United States and the European Union reached an agreement on ensuring energy security. This year, the United States has added 15 billion cubic meters of natural gas supply to Europe, helping Europe get rid of its dependence on Russia for energy before 2027. By 2030, the United States guarantees that Europe will receive 50 billion cubic meters of liquefied natural gas each year. Correspondingly, Russia delivers approximately 150 billion cubic meters of natural gas to Europe through pipelines each year, in addition to 14 billion to 18 billion cubic meters of liquefied natural gas.
Based on the current situation, the amount of supply from the United States to Europe is negligible. In 2021, Russia transported 35.9 million tons of crude oil to European refineries via Druzhba, equivalent to 720,000 barrels per day.
Russian gas enters Europe through four main pipeline routes: the “Nord Stream 1” pipeline goes from the Baltic Sea to Germany; the Yamal-Europe pipeline goes from Belarus and Poland to Germany; Ukraine’s pipelines go to Slovakia, Hungary, Romania, and Poland; the Turkish pipelines (Blue Stream and TurkStream) connect to Bulgaria, Serbia, and Hungary.
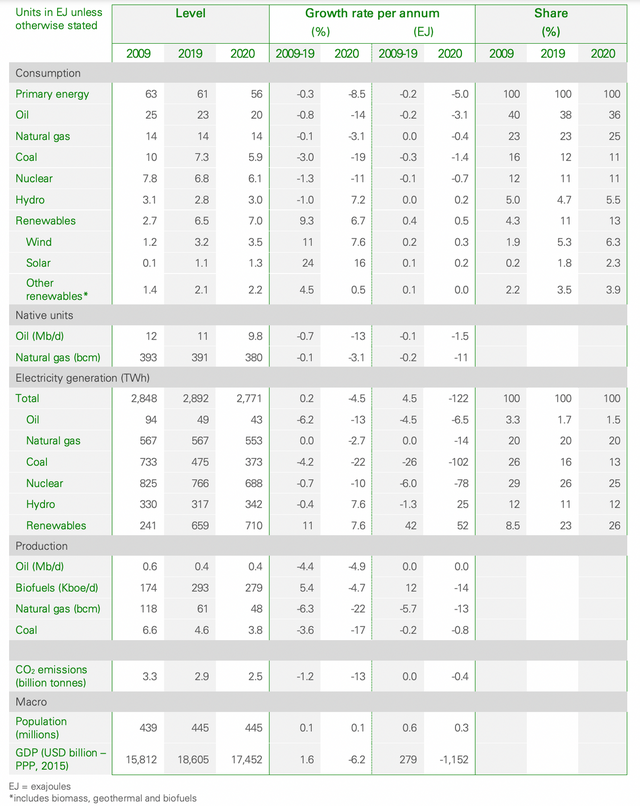
The three largest energy sources in European energy consumption are crude oil, natural gas, and coal, and Europe relies on imports for all three, making its energy structure fragile. In 2021, Europe’s natural gas consumption was about 480 billion cubic meters, of which about 90% was imported. The European Commission currently hopes to reduce Europe’s energy risks by opening up diversified oil and gas supply channels and increasing the import of liquefied natural gas from major producing countries such as the United States and Qatar. At the same time, it plans to improve energy efficiency, save energy consumption, and save 90 billion cubic meters of natural gas.It is almost impossible for Europe to change the “energy bottleneck” in importing energy in a short period of time, and there are structural contradictions in the period of energy transformation.
Electricity Situation in Europe
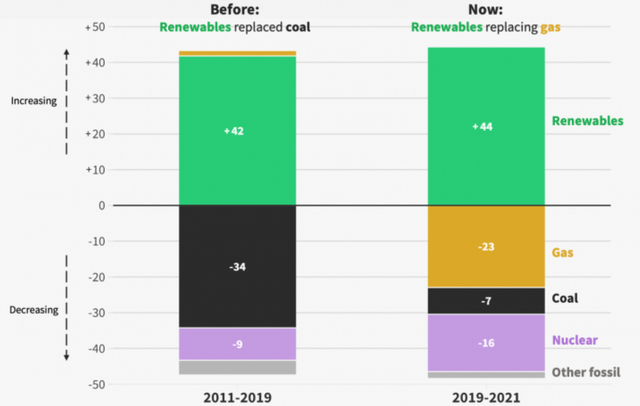
The European Electricity Review 2022 contains many interesting data and statistics. I have excerpted some content to provide everyone with a summary. From a historical perspective, continuously growing renewable energy in Europe has replaced coal-fired power. As natural gas prices skyrocketed in the second half of 2021, the growth in renewable energy was mainly used to replace natural gas, which will further exacerbate the current situation.
Image
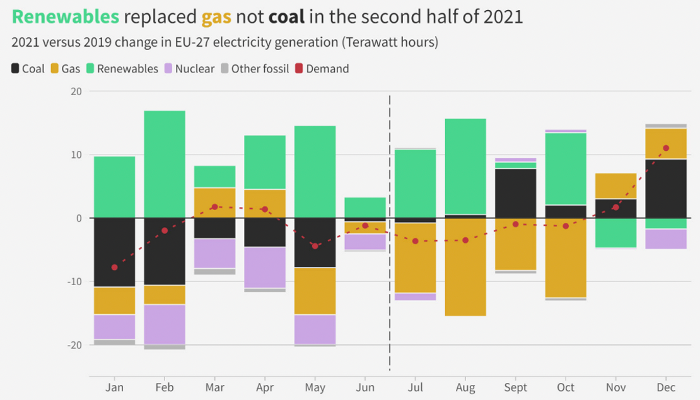
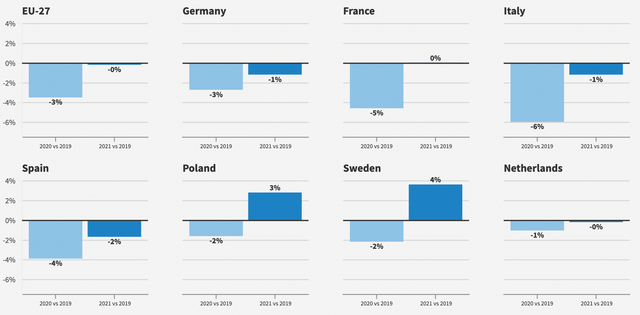
2021 was a year in which Europe began to recover to normal. From the perspective of electricity demand, the demand has gradually started to recover to the level of 2019, and the overall electricity demand is expected to increase in 2022.
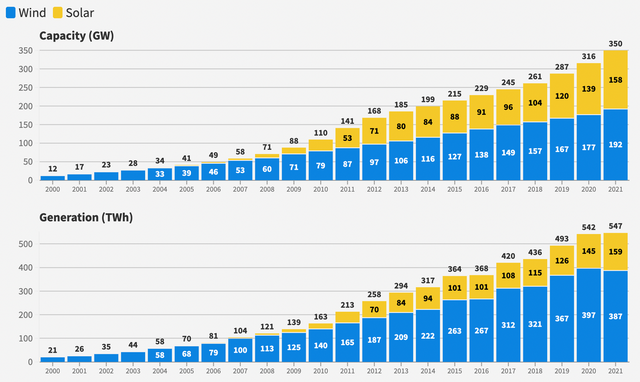
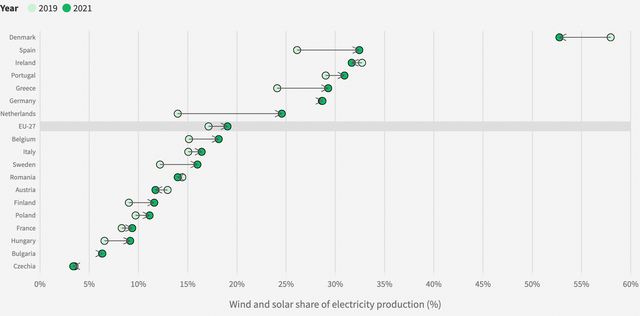
- Except for September, renewable energy in Europe set new records each month in the second half of last year. Wind and solar energy set a new record in 2021 (547 TWh) and surpassed natural gas (524 TWh) for the first time in power generation. Solar energy is booming in northern and southern Europe, with a 27% increase in power generation in 2021 compared to 2019, and power generation in the Netherlands and Spain doubled during the same period. In 2021, the installed capacity of wind and solar energy in the entire European Union continued to grow. The installed capacity of wind and solar energy is estimated to have increased by 8% (+15 GW) and 16% (+22 GW), respectively.
Except for September, wind and solar energy generation in the European Union set new historical highs in the second half of 2021. Under low wind conditions, the wind power output in the second half of 2021 increased by 2% compared with the same period last year when there was a lot of wind. The high electricity prices in Europe are mainly due to the exceptional rise in natural gas prices.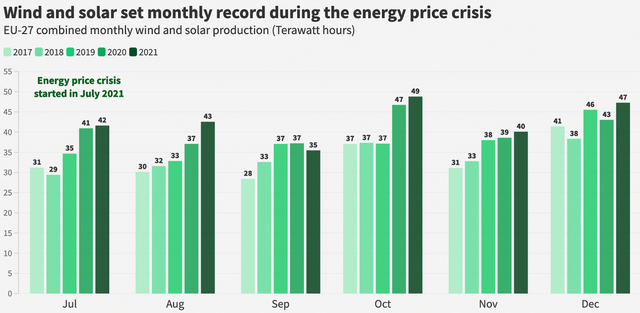
From the perspective of European countries, Spain, the Netherlands, and Greece have become new engines for wind and solar energy growth in the European Union, with the market share of wind and solar energy increasing by about 10 percentage points in just three years. In 2021, wind and solar energy provided one-third of the electricity in Spain, and at least one-fourth in the Netherlands and Greece. These countries contributed more than 50% of the growth in wind and solar energy production in the European Union.
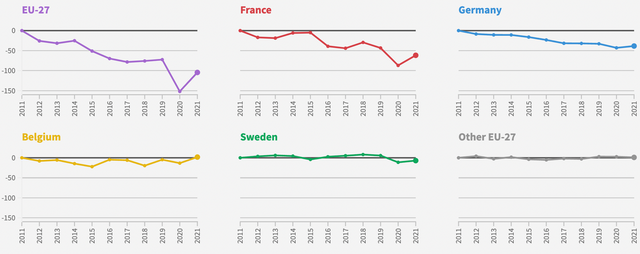
- In 2021, the electricity production of nuclear power plants in the European Union reached 733 TWh. With the availability of French and Belgian power plants improving, this increased by 7% (+47 TWh) compared to 2020. However, the electricity generation of nuclear power is still 4% lower (-32 TWh) than that of 2019–this is headstrong as there is a lack of energy, yet nuclear power plants are still forcibly closed. In 2021, nuclear power accounted for 26% of the EU’s electricity production, lower than 29% a decade ago. Since 2019, the main reasons for the decrease in nuclear power output are France (-18 TWh), Sweden (-13 TWh), and Germany (-6 TWh).
- The price of natural gas has risen exponentially in 2021. Compared with December 2020, the TTF (EU natural gas benchmark contract) rose by 585% in December 2021.
The surge in natural gas prices is caused by a combination of factors: the cold winter at the beginning of 2021 depleted natural gas inventories, Asia and South America’s demand took away liquefied natural gas (LNG), the global demand for natural gas increased after the pandemic, and the decrease in Russia’s natural gas exports. This led to European power costs (averaging 255 euros/MWh) being nearly seven times that of the same period last year, causing electricity prices in Europe to soar. In December 2021, the monthly wholesale electricity price in the European Union reached a historic high, with France (275 euros/MWh), Germany (221 euros/MWh), Greece (235 euros/MWh), Italy (281 euros/MWh), Hungary (246 euros/MWh), Spain (239 euros/MWh), and the Netherlands (238 euros/MWh).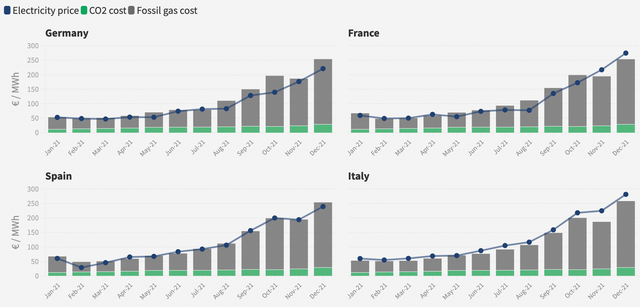
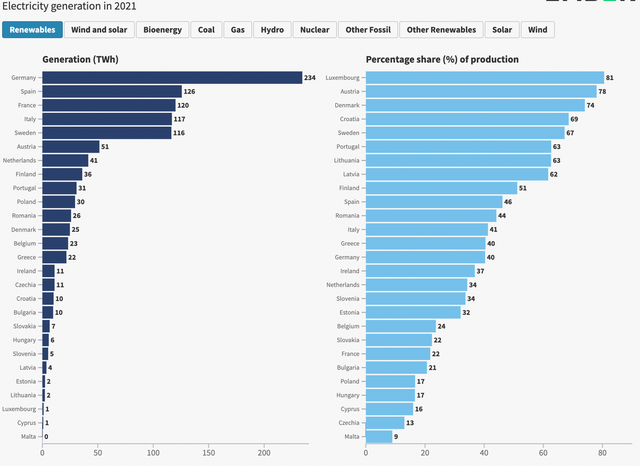
Overall, Germany, Spain, France, Italy, and Sweden are among the top power generating countries in Europe.
Summary: After examining Europe’s energy issue, it is clear that China is also facing enormous challenges. The responsibility of managing energy resources lies in the hands of the country. Developing new energy vehicles and strategies is not solely about profit but rather a strategic necessity for a country and its people to survive and thrive over a long period of time.
This article is a translation by ChatGPT of a Chinese report from 42HOW. If you have any questions about it, please email bd@42how.com.