(Impatient friends can skip directly to the conclusion at the end.)
Power Consumption
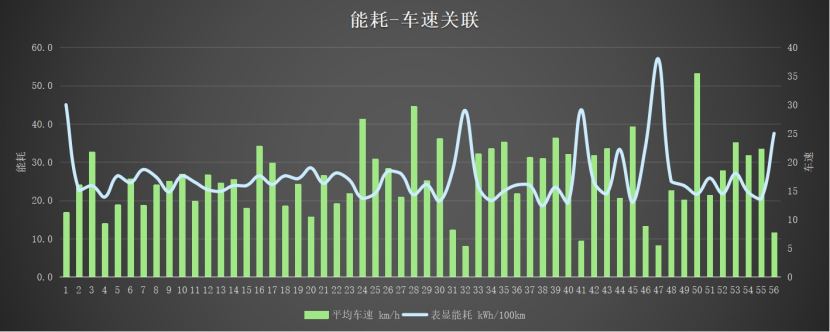
The most important information for every new energy vehicle owner is how much power their car consumes. Some ride-hail drivers choose not to use air conditioning in order to increase their vehicle’s range. We all know that power consumption is related to many factors, with air conditioning just being a small part of it. When the vehicle is on the road, the main energy consumption comes from the driving system and the driving resistance. Based on 56 recorded trips, I have summarized the following data (see Figure 1):

Figure 1: Comparison chart of energy consumption per hundred kilometers and vehicle speed
First, let me describe my power output settings: D gear, ECO PRO driving mode, and medium energy recovery mode. Occasionally use SPORT mode. Looking at Figure 1, it is obvious that the three sets of data, 32#, 41#, and 47#, are more prominent than the others. The common feature is an extremely low average vehicle speed, around 5 to 6 km/h. That is, according to BMW’s built-in energy consumption calculation logic and electric drive calibration logic, energy consumption is very high during low-speed coasting. As the average vehicle speed increases, energy consumption will decrease and stabilize at 14.5 to 15 kWh/100 km.
Since the selected trip records have an average vehicle speed between 20 to 30 km/h, friends who drive mostly in urban areas can use the above data as reference. Once we have some highway driving data, we will provide additional explanation.

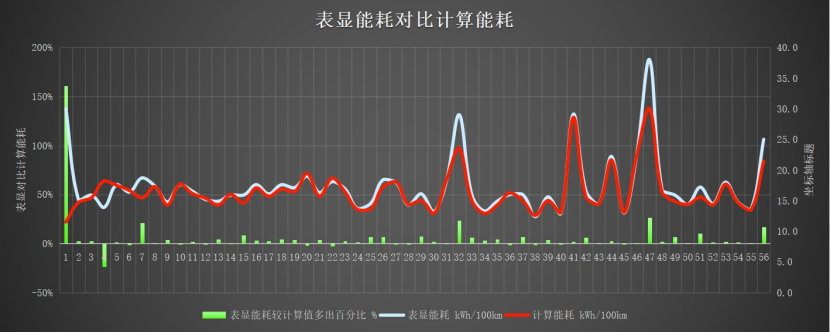
Figure 2: Comparison of displayed energy consumption and calculated energy consumption differenceIn addition, many new energy vehicle owners have questions about the energy consumption and remaining mileage displayed on the dashboard, and I am no exception. Some new energy vehicles display excessively optimistic remaining mileage, which can lead to running out of power halfway through a trip. At this point, the vehicle owner usually curses the manufacturer for false mileage claims. This type of displayed mileage is even jokingly referred to as the “happy meter”. On the other hand, some new energy vehicles display too pessimistic remaining mileage, which leads the owner to believe that the manufacturer has greatly exaggerated the range. Regardless of the situation, new car owners feel anxious. In this issue, we focus on the BMW i3 and examine its performance.
As can be seen from Table 2, the white line is usually higher than the red line. This means that the displayed energy consumption of the BMW i3 is generally higher than the actual energy consumption (power consumption divided by mileage). Occasionally, there are large discrepancies (data point 1#), such as when driving the car home after just taking delivery. Sometimes, there are discrepancies of around 20% (data points 7#, 32#, 47#, 56#).
There must be a reason behind this. Is it related to driving speed? Let’s take a look at the average speeds of these data points (16.8/18.7/8/8.2/11.5 km/h). Yes, at lower speeds, the displayed energy consumption is significantly higher than the calculated energy consumption. More precisely, at lower speeds and very short distances (less than 2km), the difference between the displayed and actual energy consumption is greater. Since the displayed remaining mileage is proportional to the displayed energy consumption, if the displayed energy consumption is high, the remaining mileage will be low. I have seen the most extreme case of an i3 owner who, after fully charging their car, showed a remaining mileage of only 250km. But in reality, it can definitely run more than 250km.
At this point, some people may raise the question: “I don’t care about these technical details, I just want to know how far the car can actually go.” Okay. Let’s take the measured range as an example. Please refer to Table 1:
 ## Table 1: Actual Endurance Mileage After Three Uses
Some additional explanations about these three uses: In the first two times, I charged from 90% to 40%. Only the last time did I charge from 100% to 4%. According to Table 1, it is no problem to drive a BMW i3 with a nominal range of 526km for 380-420km in the summer in the south of China. Whether it is 380km or 420km depends on your driving habits, such as whether you are energy-efficient and often drive in low-speed congested road sections. Those who often step on the accelerator and get stuck in traffic jams will have a lower actual on-road endurance.
Charging
Charging is another topic of concern for everyone. “How long does it take to fully charge my car with slow/fast charging?” “If I charge for 15/20/30 minutes at a highway service area, how much electricity can I get?” These questions are what new car owners want to know most. We will look at this in two steps. The first step is to look at how high the charging power is, and the second step is to see how long it takes to charge to a specified percentage using a fast charging pile when energy is temporarily needed during the journey.
Charging Power
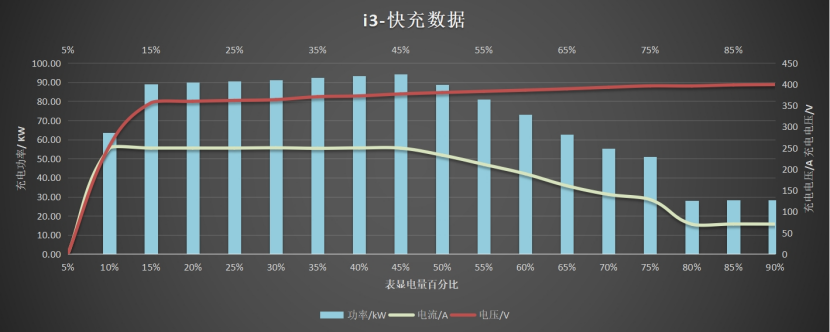
For fast charging, please refer to Figure 3:

Figure 3: Changes in charging power during fast charging (displayed at the charging pile)
The data in Figure 3 comes from a fast charging process. From here, it can be seen that the power change during the entire charging process can be divided into four stages (see Table 2):

Table 2: Fast charging process information
Next is the information of the slow charging process. Please refer to Table 3:

Table 3: Slow charging process informationData interpretation: The average power of slow charging pile is around 7kW. Starting from 5% battery level, it takes about 11 hours to fully charge.
There are two common ways for people to use slow charging piles. The first is home charging, where the charging is usually not started from a battery level of 5%. The plug is inserted upon arriving home and the battery is usually fully charged by 7am the next morning. The second is commercial slow charging piles. If the battery level drops to 5% due to traffic jams, charging can be started at midnight and can reach around 80% by 8am, supporting a 300km journey. Even for cross-city commuting in Guangzhou and Shenzhen, this should not be a problem.
Emergency charging
For data on charging time and amount of electricity added during fast charging in emergency situations, please refer to Table 4:

Table 4: Charging time and added range based on specified electricity level
According to Table 4, if the battery level is at around 5% and an emergency fast charging station is available, 5 minutes of charging can add 40km of driving range, while 20 minutes can add 180km. However, according to charging power in Table 2, the charging power decreases after 20 minutes, therefore, it might be more efficient to drive to the next charging pile rather than spend more time at the current one. Of course, if you insist on charging to 90% or even 100%, it will take close to or more than an hour (5-90%@57 minutes, 5-100%@1 hour 11 minutes).
Data credibility
The above data was collected and analyzed by myself using my own purchased car, with a purely objective and fair stance. However, as I am just an individual user, there is a possibility that my results are not reliable. Therefore, let us compare and judge the reliability of my results by looking at tests conducted by authoritative organizations or major media outlets.
Official organizations
Here, because the i3 model is only available in China, the closest and most comparable model I could find was the BMW i4. Therefore, I will first share the results of a range test conducted by a German official agency on the i4 model:
Figure 4: ADAC tested the road endurance (Source: https://www.adac.de/)
The result “490km” in the second column is the result obtained by ADAC for the actual road endurance test of BMW i4 according to their set conditions. Roughly converted based on the nominal electricity of i3 and i4. The measured value of i3 is about 410km. Considering that the motor power of i4 is greater and the tires are larger, the electricity consumption per 100km would be greater than that of i3. Therefore, the highest endurance of 426km presented in this article is still reliable.
Domestic media evaluation
In the summer test of DCD, BMW i3 achieved a range of 339.7km with a energy consumption of 20.6 kWh/100km in the high temperature of 50℃. In addition, you can also refer to Electric Vehicle Laboratory’s “How Far Can BMW i3 Go at 120km/h? | Real Electric Car Test PLUS”. They tested that BMW i3 can reach 349km at an average speed above 100km/h. As we all know, high temperature/cold temperature/high speed are the most challenging scenarios for pure electric vehicles. Under the normal use of the city combined with high speed in non-extreme temperatures, the lowest endurance of 380km presented in this article is also acceptable. However, the endurance test results below zero degrees are currently missing. Let’s take a look at the results of DCD’s winter test later.
Conclusion
- The electricity consumption per 100km for urban driving is 14.5~16.0kWh, and the actual endurance is 380~426km;
- Starting from 5%, fast charging takes one hour and ten minutes to fully charge, while slow charging takes eleven hours;
- If the car is out of power and you need to hurry, but you think 2 yuan per kilowatt hour is too expensive, just charge it at a fast charging station for 20 minutes.4. The remaining battery level and mileage displayed on the dashboard are the most conservative estimates. I refer to it as the “sad table that makes you cry while sitting in the car”.
This article is a translation by ChatGPT of a Chinese report from 42HOW. If you have any questions about it, please email bd@42how.com.
