Author: Zhu Yulong
After writing the previous article, some of you may have felt that it was a bit empty, so I thought I could provide some perspectives in several dimensions:
- Perspectives on market share
- Perspectives on supply patterns
- Perspectives on product specifications and technological development
I want to briefly touch on the market share and supply pattern aspects first, and then conduct some in-depth explorations on this industry around the development of product technology. According to data from the NE research institute, the installed capacity of electric motor electronic control systems for new energy passenger cars in May reached 357,700 units, a year-on-year increase of 71% and a month-on-month increase of 26%; The cumulative installed capacity of electric motor electronic control systems for new energy passenger cars from January to May this year was 1.7519 million units, accounting for 53.8% of the total installed capacity for the whole year last year.
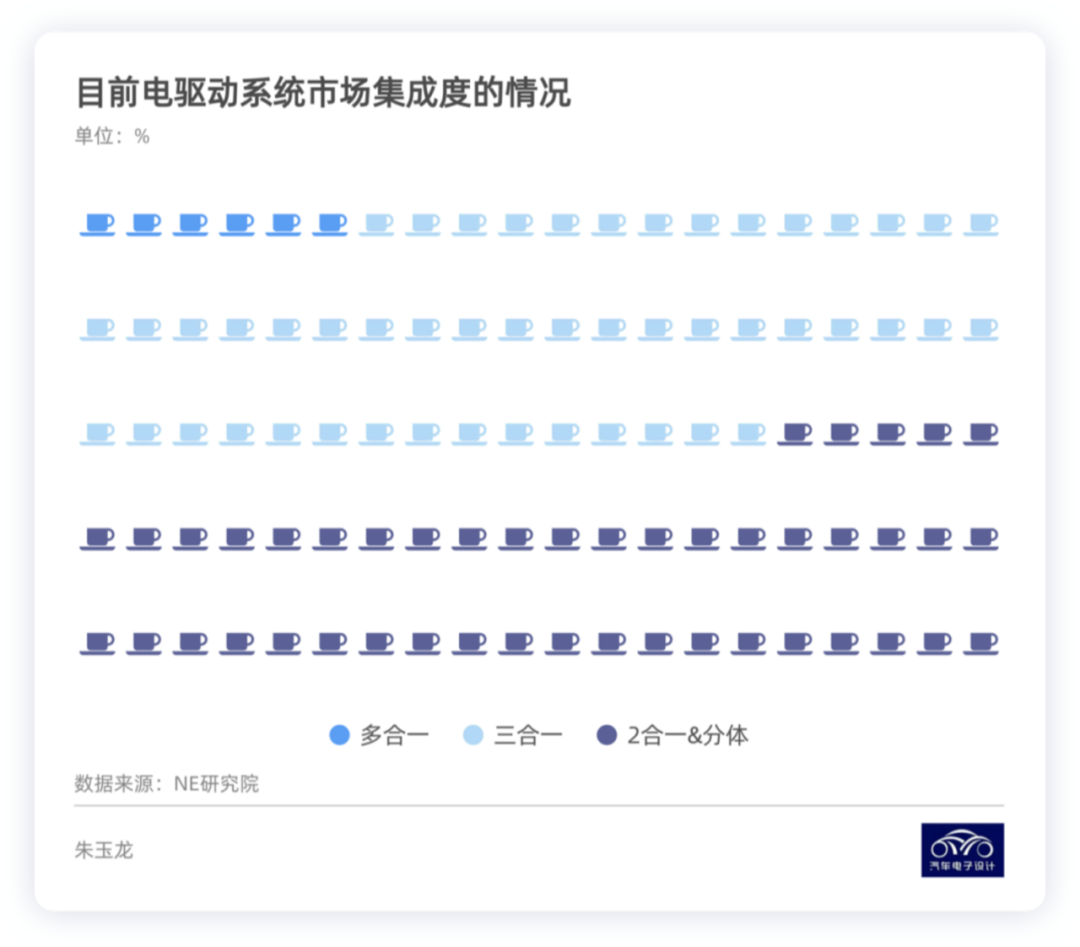
Market Share of Electric Drive Market
Currently, from the perspective of integration trend, the installed capacity of three-in-one electric drive systems in May was 195,700 units, and the installed ratio reached 54%; Multi-in-one driver has already accounted for 6%.
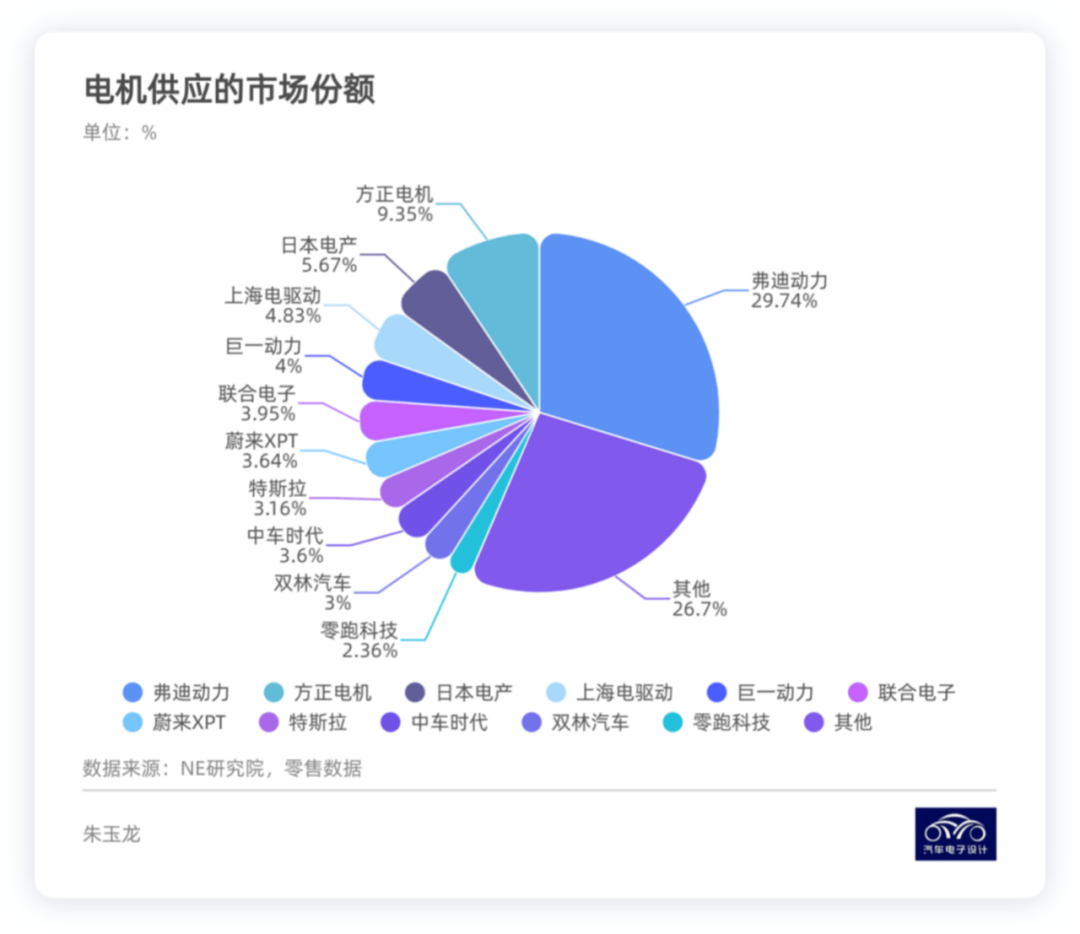
- Motor
The market share of motors depends heavily on the number of whole vehicle companies. The top three equipment companies in terms of installations are Freudenberg Power (owned by automakers themselves), Fangzheng Motor, and Nidec. Tesla’s supporting equipment is gradually recovering (estimated to surpass 70,000 units in June), and Huichuan’s supporting equipment for Ideal has increased significantly. As of May 2022, the top three installation companies for electric motor drive systems for new energy passenger cars are still Freudenberg Power, Fangzheng Motor, and Tesla. This also objectively reflects that building motors by automakers is still a big trend, and it is very logical to open the motor when the volume is reached.
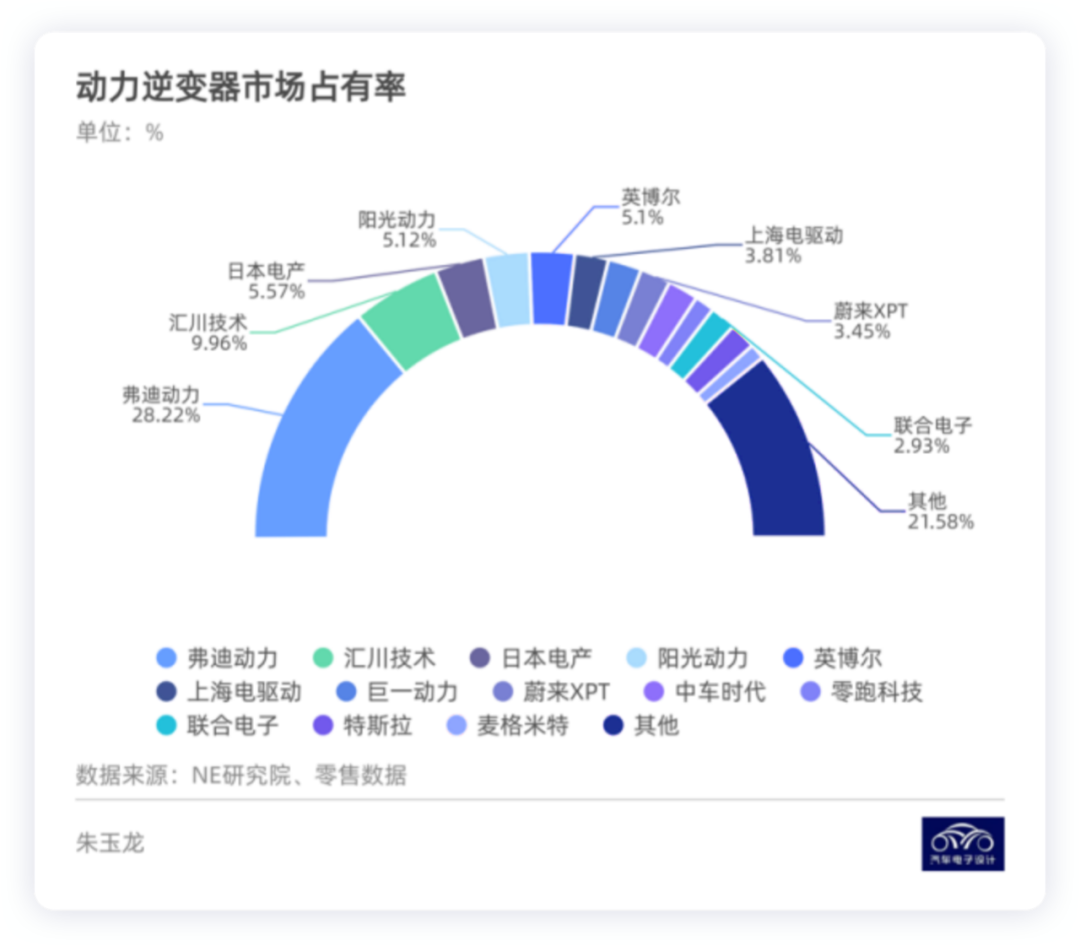
- Electronic Control
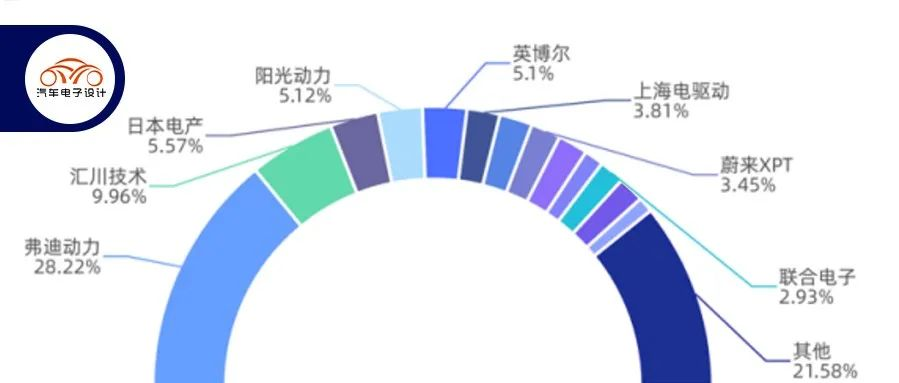
The top three motor controller companies in terms of installation are Freudenberg Power, Huichuan Technology, and Nidec. Unlike motors, this is about power electronics design, where we can see some companies. In fact, in this area, inverter companies may string together a few things, and the top three electric drive system-equipped installation companies are still Freudenberg Power, Nidec, and Huichuan Technology. I’ll take some time to explain the inverter situation later.
Supply Pattern
- MotorThe following is the English Markdown text with HTML tags preserved:
I won’t say much about this because I think this image can lead to some discussions on the different approaches used by car manufacturers when allocating to different suppliers.
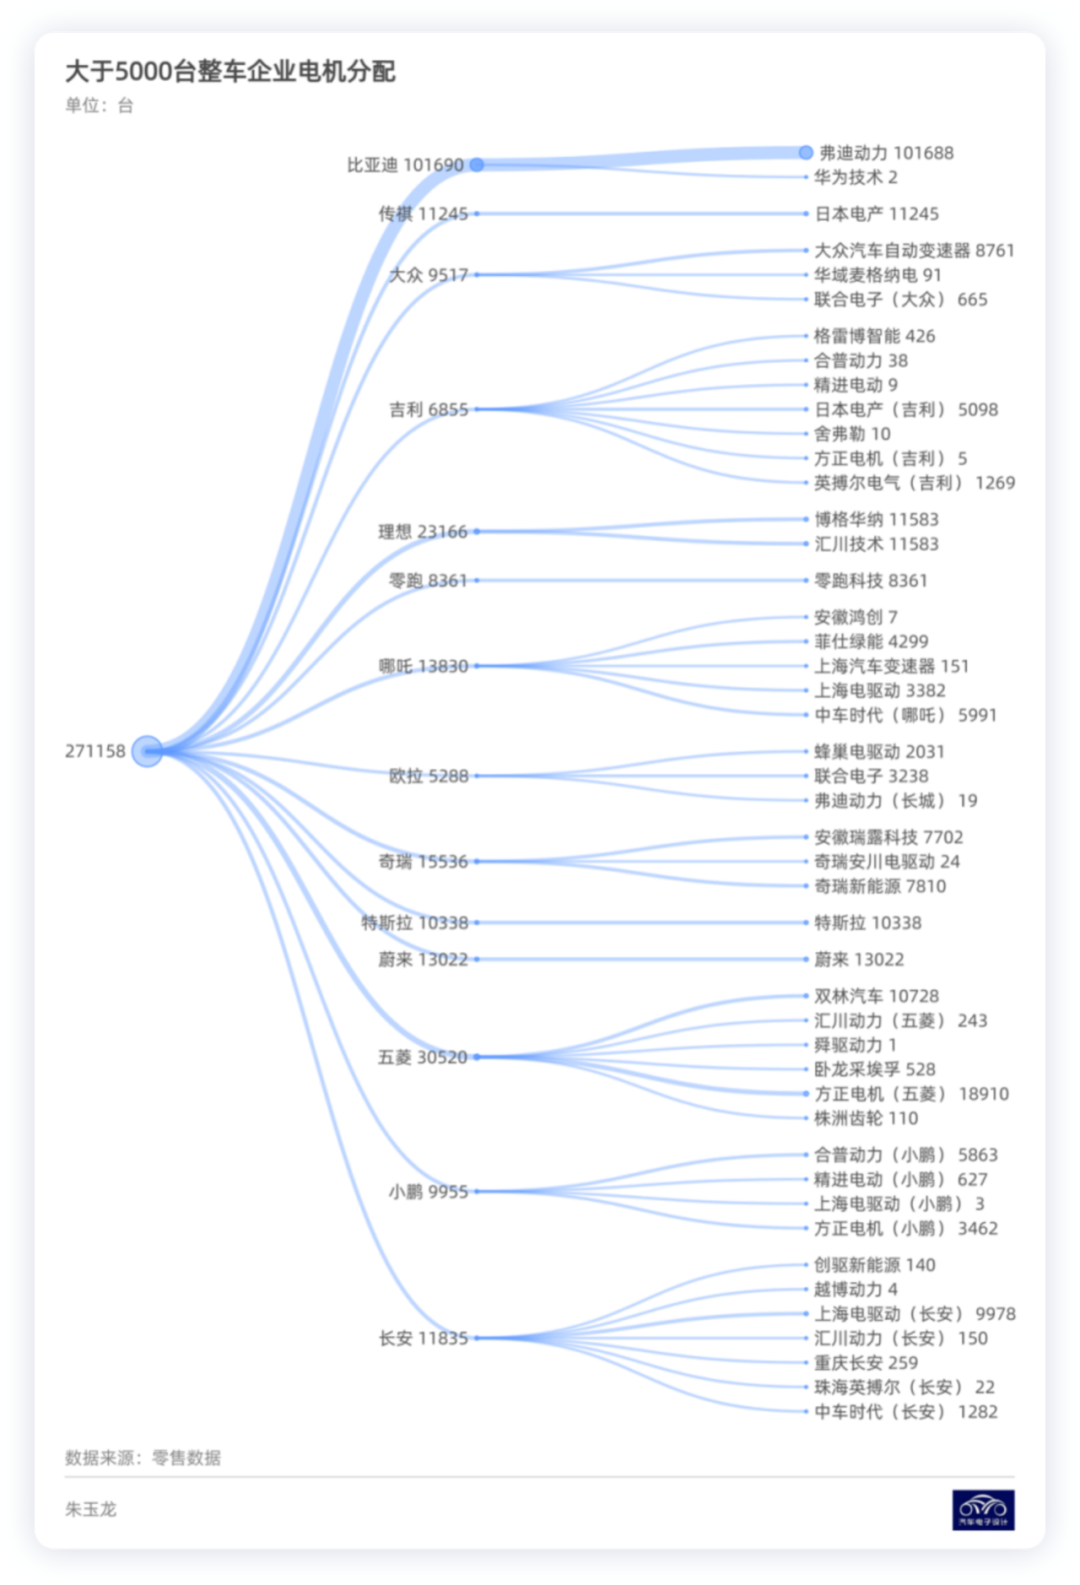
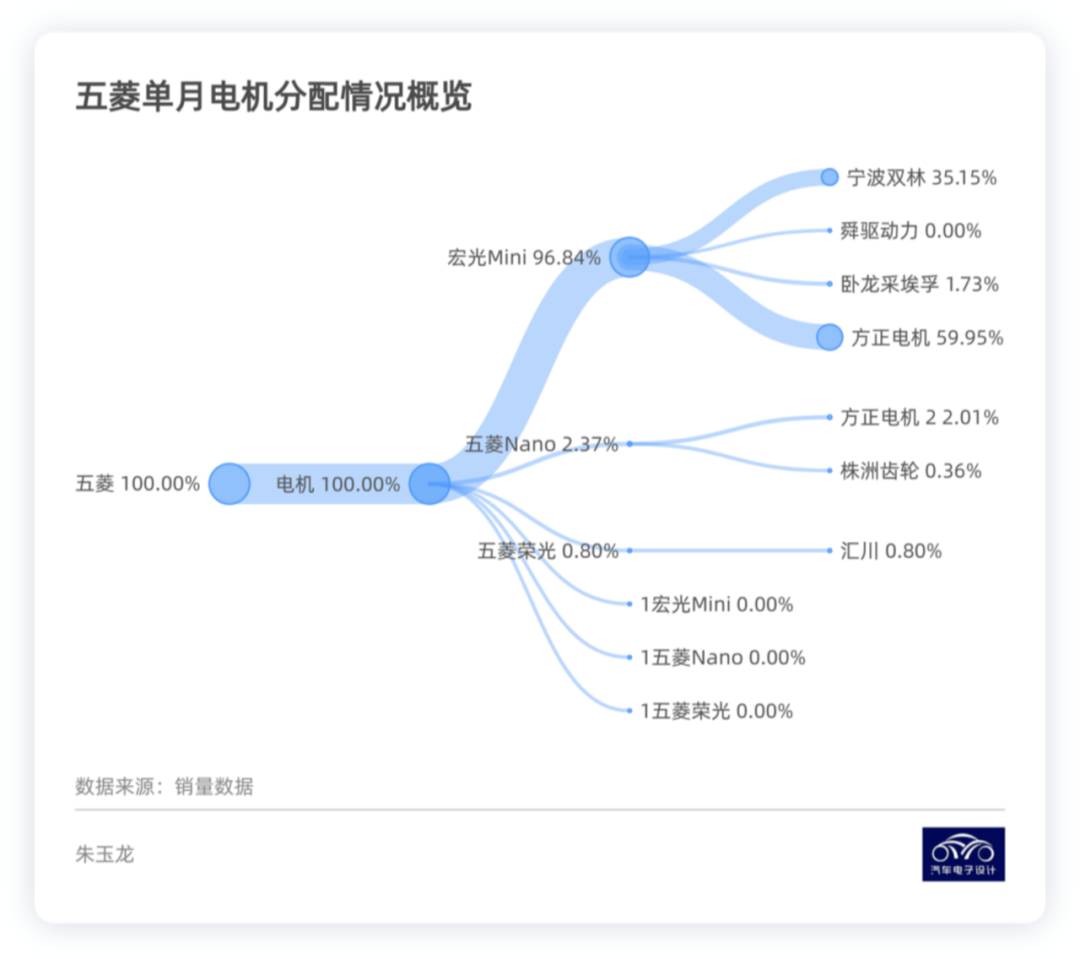
In fact, it would be best to expand each enterprise according to the vehicle model, and I think the visualization effect would be better in the later stage.
I’ll simplify the supply pattern of inverters as shown below. It needs to start from different power levels and there are many areas that can be explored.
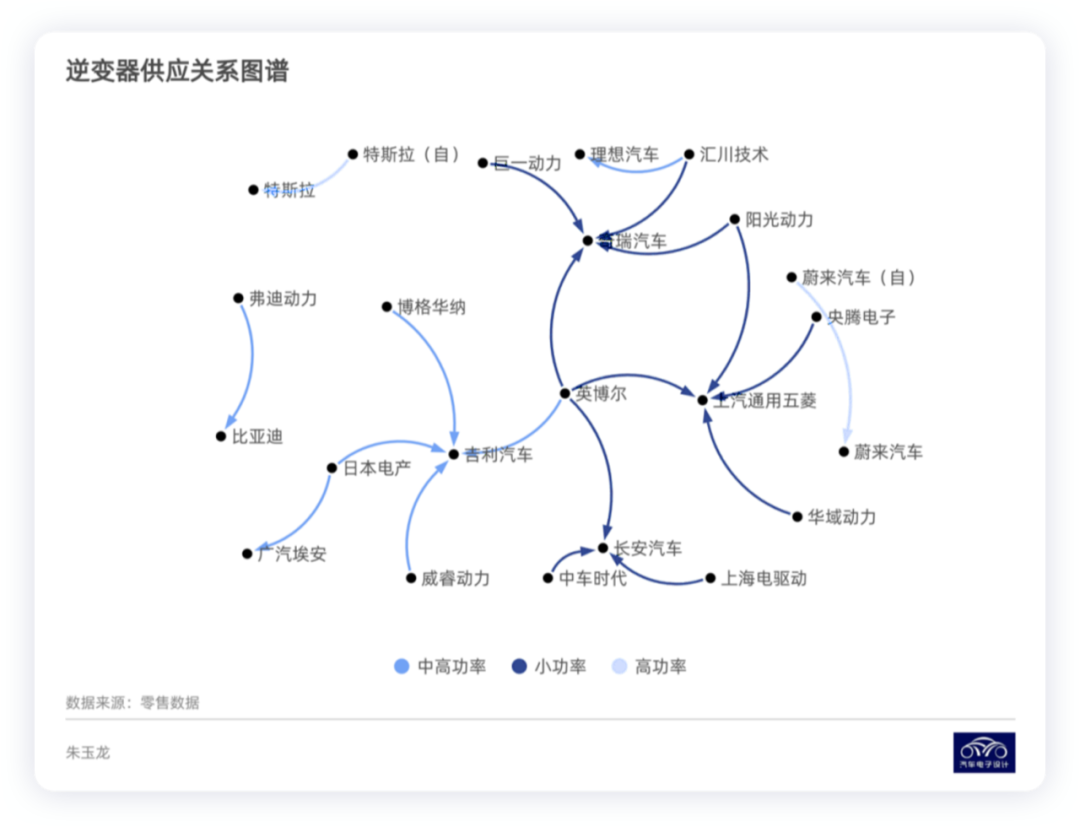
Conclusion: Visual work is time-consuming. However, after it is sorted out, the logical relationships can be clearly outlined for reference.
This article is a translation by ChatGPT of a Chinese report from 42HOW. If you have any questions about it, please email bd@42how.com.
