Text:
Word Count: 1,652
Estimated reading time: 10 minutes
From this point on, let’s use Apple as an example to analyze Tesla.
Although Apple and Tesla have their own characteristics and completely different main industries, the frameworks and data listed below may not be suitable for comparative analysis. However, these two are often compared in the market. Both are the highest-valued companies in their respective industries, both are hardware companies that support software, and the products they release are often regarded as the dividing line for the next era of intelligence. Therefore, using Apple to analyze Tesla may be a suboptimal solution, but it is still a relatively close option.
Let’s start with analyzing Tesla’s product penetration rate, establish a model to analyze Tesla’s long-term ROE, and finally verify the possibility of achieving goals based on model data.
First from the perspective of product market share, we can basically see the combat effectiveness of the two products in local battles.
Apple’s global smartphone market share in 2021 is basically maintained at around 15%. Looking at larger regions, it is currently around 50% in North America, around 25% in China, and around 30% in Europe.
Tesla’s global new energy vehicle market share in 2021 is around 15% (Tesla: new energy = 930,000: 6 million). Looking at larger regions, it is currently around 54% in North America (Tesla: new energy = 360,000: 660,000), around 10% in China (Tesla: new energy = 320,000: 3 million), and around 8% in Europe (Tesla: new energy = 160,000: 2 million).
Zooming out slightly, we can judge whether smartphones and new energy vehicles are strategically gaining an advantage in terms of product penetration rate.
In 2021, the global market penetration rates of smartphones and new energy vehicles were 62% and 8% respectively. Looking at larger regions, the penetration rates in North America were 91% and 4% respectively; in China, they were 67% and 15% respectively; and in Europe, they were 78% and 14% respectively.
Combining the above two sets of data, we can draw a preliminary conclusion.
First of all, Tesla’s product competitiveness has reached almost the same level as Apple’s on a global scale. However, Tesla’s product combat effectiveness is not as good as Apple’s in China and Europe, but it is very strong in North America.
Secondly, the gap between the global penetration rate of new energy vehicles and smartphones is nearly 8 times. The new energy battlefield is still very broad, and strategically, new energy is still a minority compared to fuel vehicles, and is not irreversible. According to the innovator diffusion model mentioned when analyzing Apple products, China and Europe are the first to enter the phase of rapid increase in penetration rate. Starting from this phase, the smart phone markets in North America, China, and Europe took approximately 8-10 years to complete a phased leap from a 15% to 60% penetration rate.Previously we talked about how products are the foundation of ROE, and a good product can create a solid foundation, resulting in a long-lasting business for ten or even several decades. After establishing an understanding of Tesla’s product competitiveness and the new energy market, we will now proceed to model and analyze Tesla’s ROE.
Because modeling is a very artistic process where each person has a different understanding of the company’s various aspects and inputs different data, the results will naturally be different. Here are some key assumptions within the model to provide some reference to readers who also have their own models.
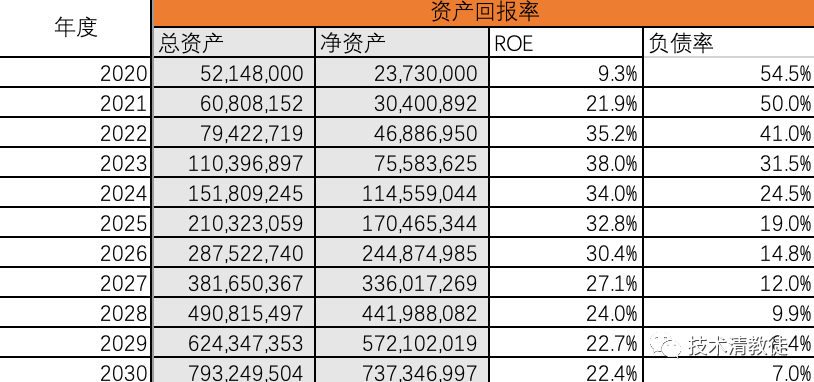
Key assumptions during the period between 2022 and 2030 are:
- Hardware: The carbon credit gross profit margin of the vehicle is maintained at 29-31% (2021 Q4 is about 29%)
- Software: The penetration rate of FSD is increased from 10% to 60% (2021 Q4 is about 7%)
- Vehicle sales volume: Increased from 1.6 million units to 8.7 million units (93,000 units in 2021, the official target for 2030 is 20 million units).

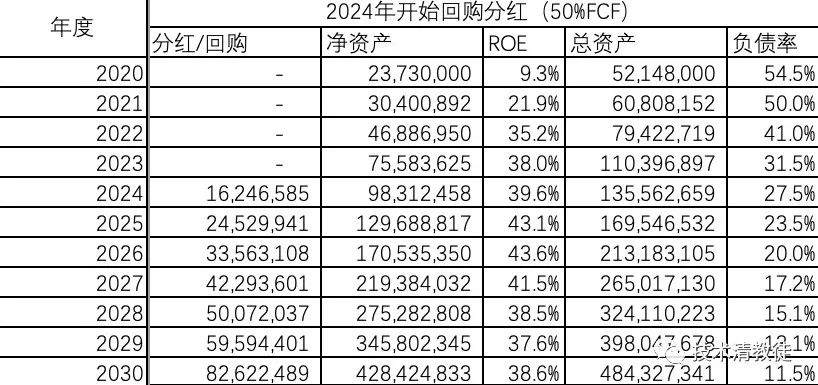
If 30% of free cash flow (deducting necessary production capacity investment) is used for dividends/buybacks after 2024, and debt is taken out annually at 30% of the scale of pre-tax net profit:

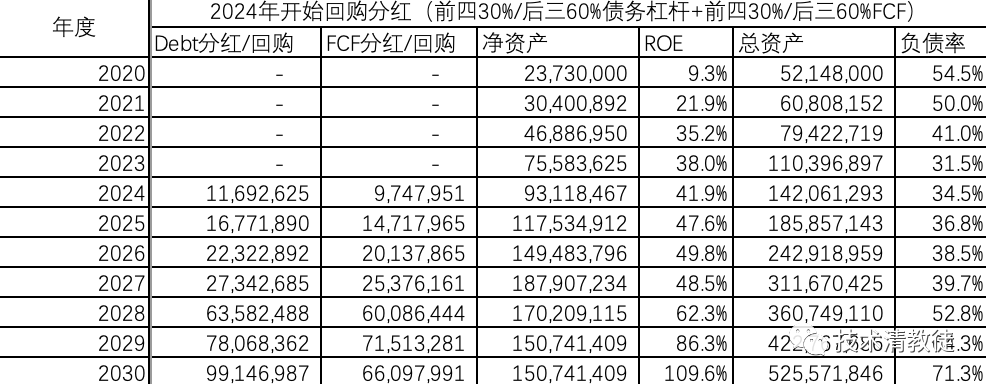
If 30%/60% of free cash flow (deducting necessary production capacity investment) is used for dividends/buybacks for the first 4 years/last 3 years respectively, and debt is taken out at 30%/60% of the scale of pre-tax net profit for the first 4 years/last 3 years respectively:

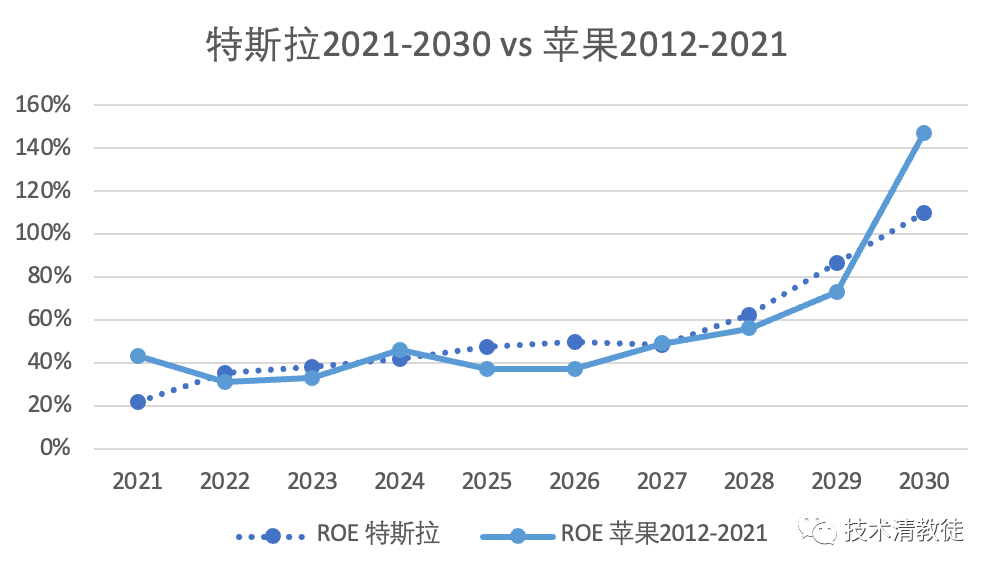
If we put the hypothetical third model’s data between 2012-2030 and Apple’s data between 2012-2021 together:

Finally, let’s overlap the two timelines and conduct a comparison of the fundamentals for both companies and the market.
Cash cow product launch time
The launch of the Apple iPhone was about 4 years after its release in 2008.
The launch of the Tesla Model 3 was about 4 years after its release in 2017.
RevenueIn 2012, Apple’s total revenue was about 150 billion US dollars, while Tesla’s total revenue in 2021 was about 50 billion US dollars.
In 2021, Apple’s total revenue was about 370 billion US dollars, and it is estimated that Tesla’s total revenue in 2030 will be about 600 billion US dollars.
Market Share
In 2012, Apple’s global market share was about 19% (30%, 10%, and 40% in the US, China, and Europe, respectively), while Tesla’s global market share in 2021 was about 15% (50%, 10%, and 8% in the US, China, and Europe, respectively).
In 2021, Apple’s global market share was about 15%, and it is estimated that Tesla’s global market share in 2030 will be about 12%.
Market Penetration
In 2012, the global market penetration of smartphones was about 15%, while the global market penetration of new energy vehicles in 2021 was about 8%.
In 2021, the global market penetration of smartphones was about 62%, and it is estimated that the global market penetration of new energy vehicles in 2030 will be about 50%.
The above data may just be incidental fit, but they can also provide some insights.
In the next article, we will release the model estimation based on Tesla’s official target of selling 20 million vehicles in 2030.
This article is a translation by ChatGPT of a Chinese report from 42HOW. If you have any questions about it, please email bd@42how.com.
