Body:
Word count: 552
Expected reading time: 5 minutes
Following up on the two articles about Apple’s ROE: (1) The Four Stages of Apple’s ROE & (2) The Secret to Apple’s Super High ROE.
The market performance of the product is the foundation of ROE and the almost only standard to test the company’s viability. This article will review the actual data of the “smartphone market”, which is the core business of Apple.
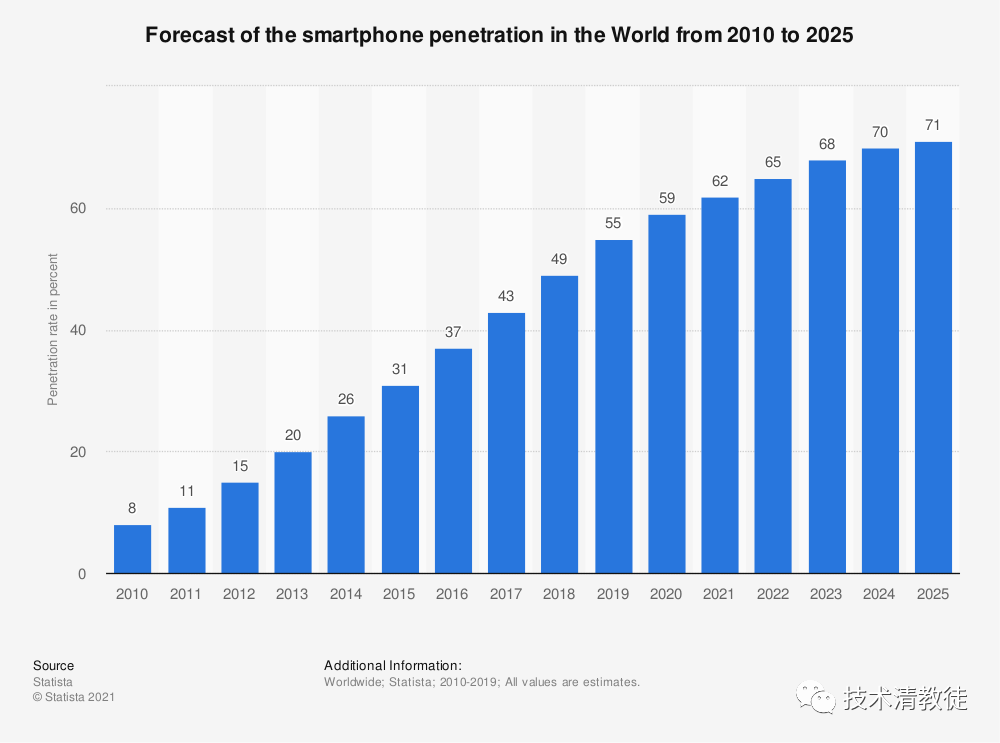
The above chart shows the historical and predicted data for the penetration rate of smartphones worldwide, and the following three images show the regional data for North America, China, and Europe.
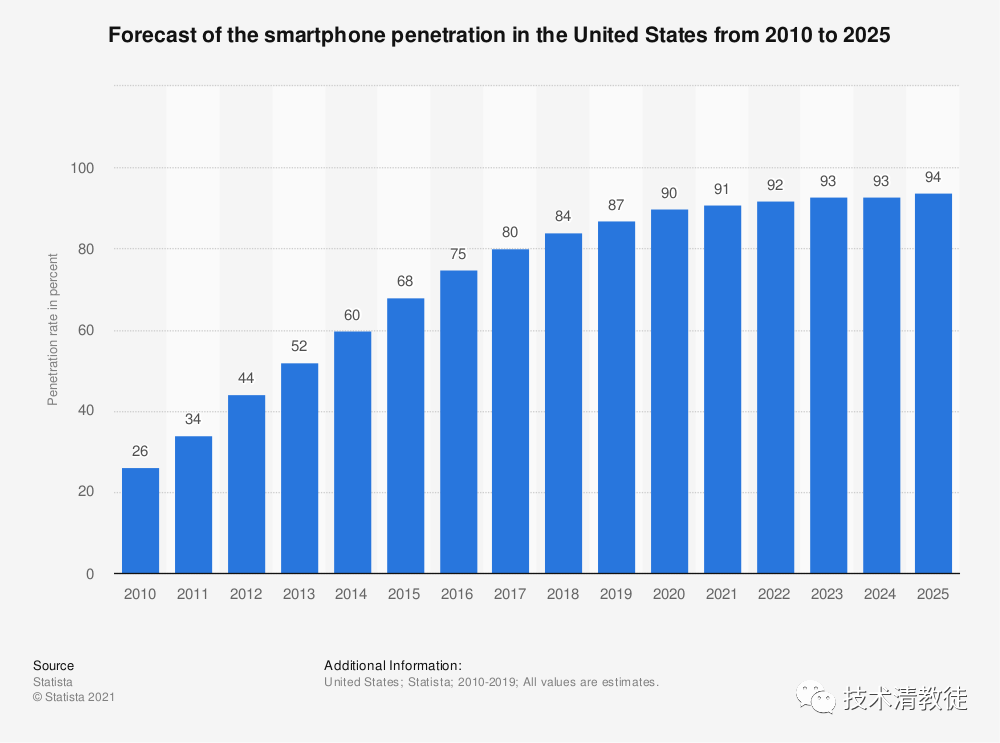
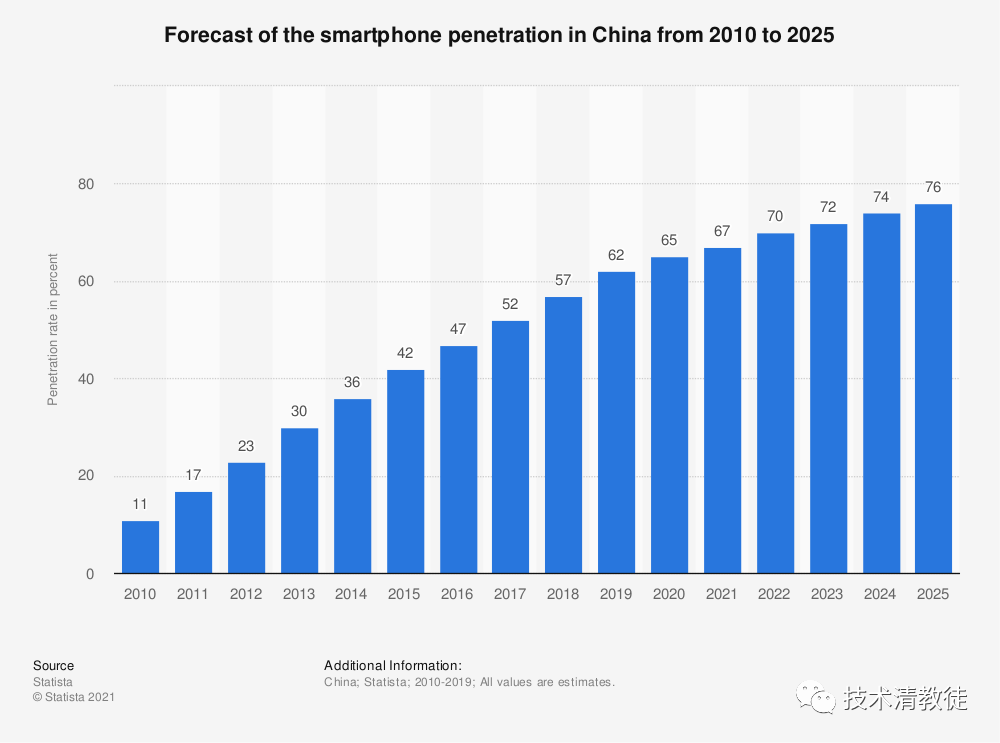
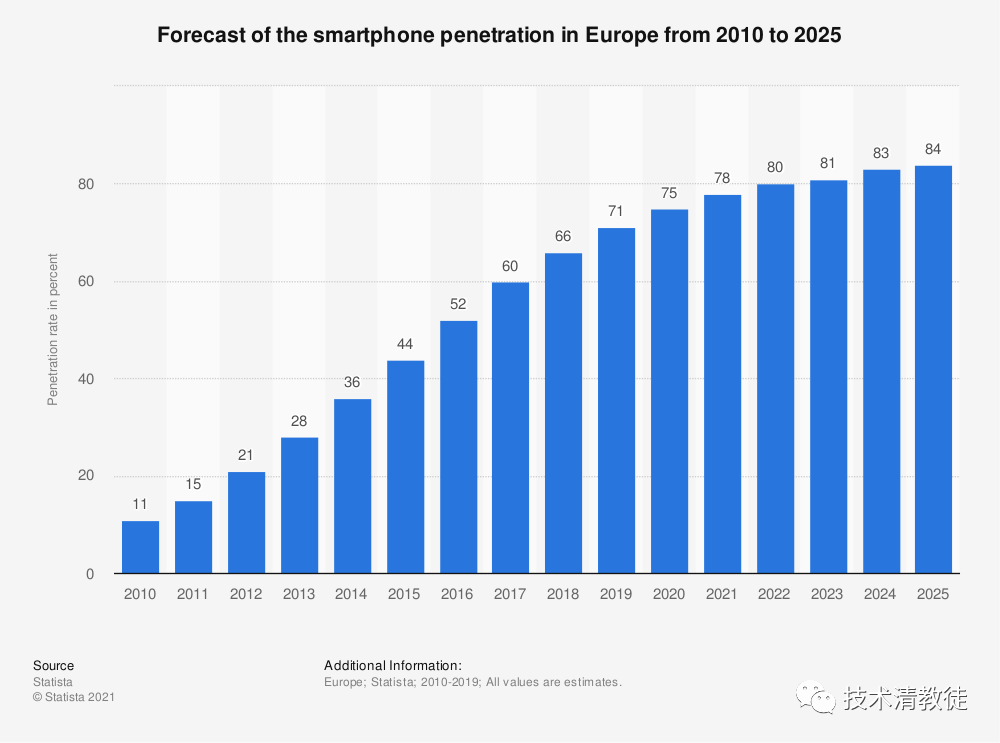
The four images above illustrate two things:
One, smartphone penetration rates have basically reached their peaks, especially in North America, followed by Europe and China, and finally, other regions of the world. Comparing the penetration rates of the world and the three regions, there is a large gap in the middle. This means that the incremental growth opportunity for the global smartphone market lies in other regions of the world, which should still be considerable.
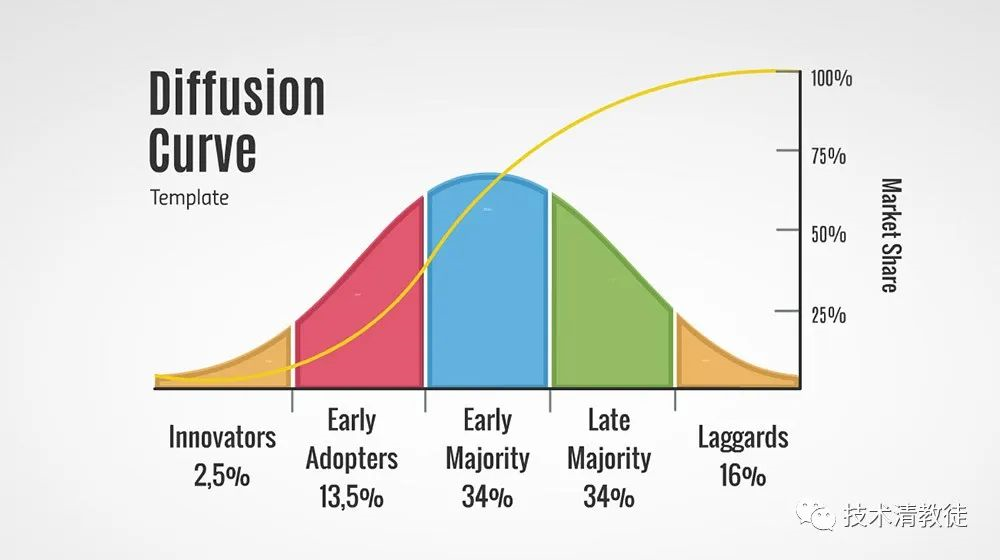
Second, the period with the fastest growth rate in smartphone shipments is the stage where the yearly penetration rate slope is the steepest, roughly between 15% and 60%. This period reminds people of a model: the innovation diffusion model (see below). The relationship between the penetration rate and the growth rate basically conforms to the model.
 ## Apple’s Market Share in Global Smartphone Industry
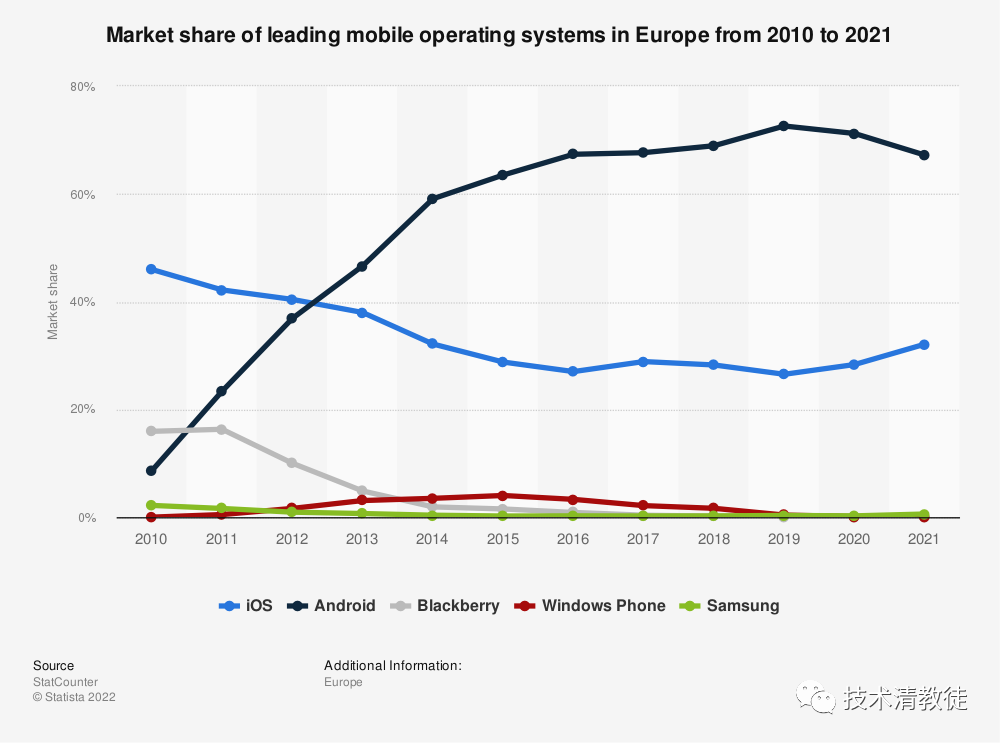
Let’s take a look at how much Apple has achieved in this big market. First, let’s look at the global market of smartphones, followed by regional markets in the United States, China, and Europe.
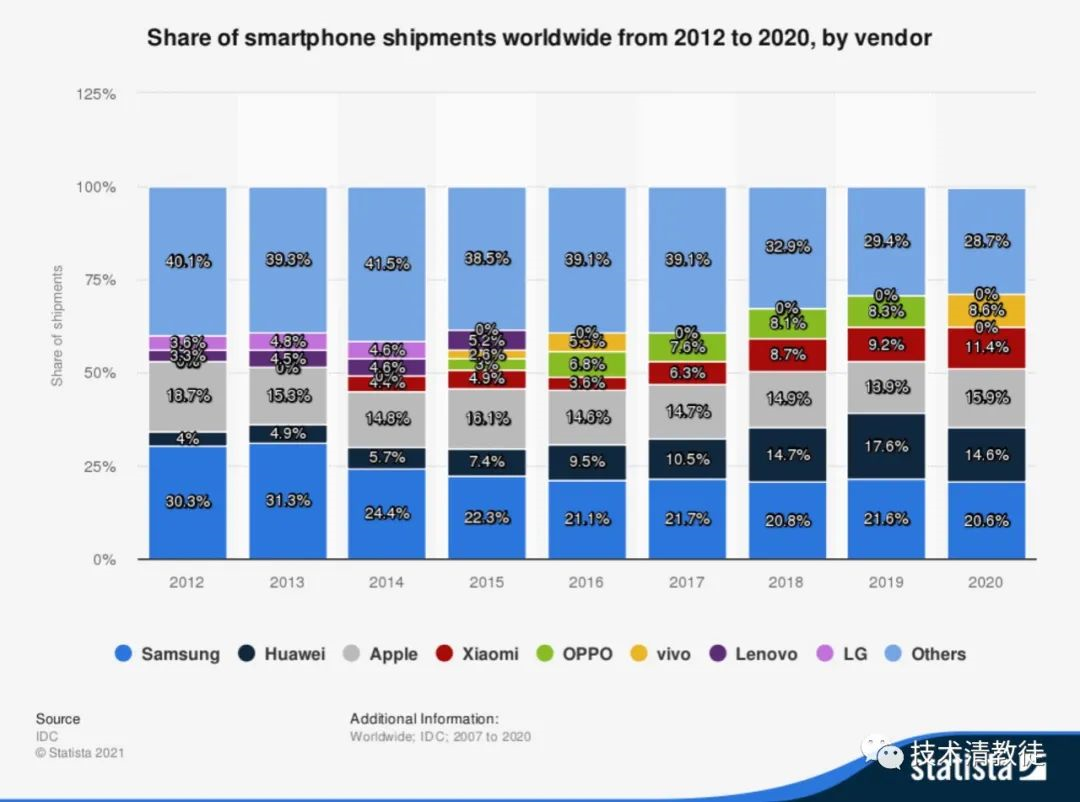
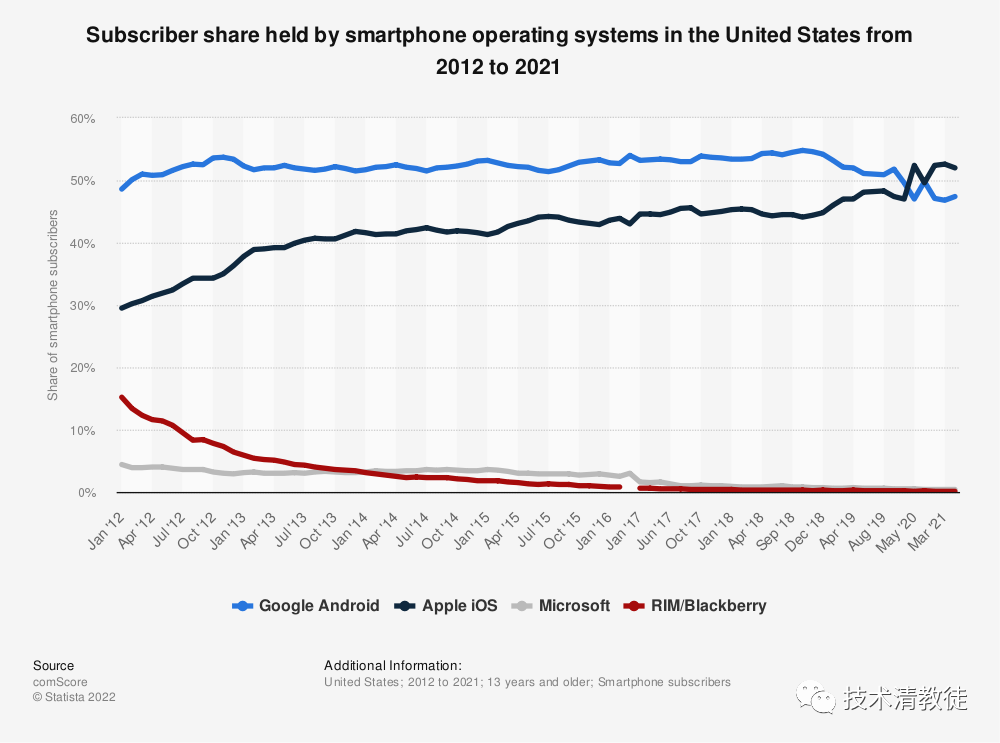
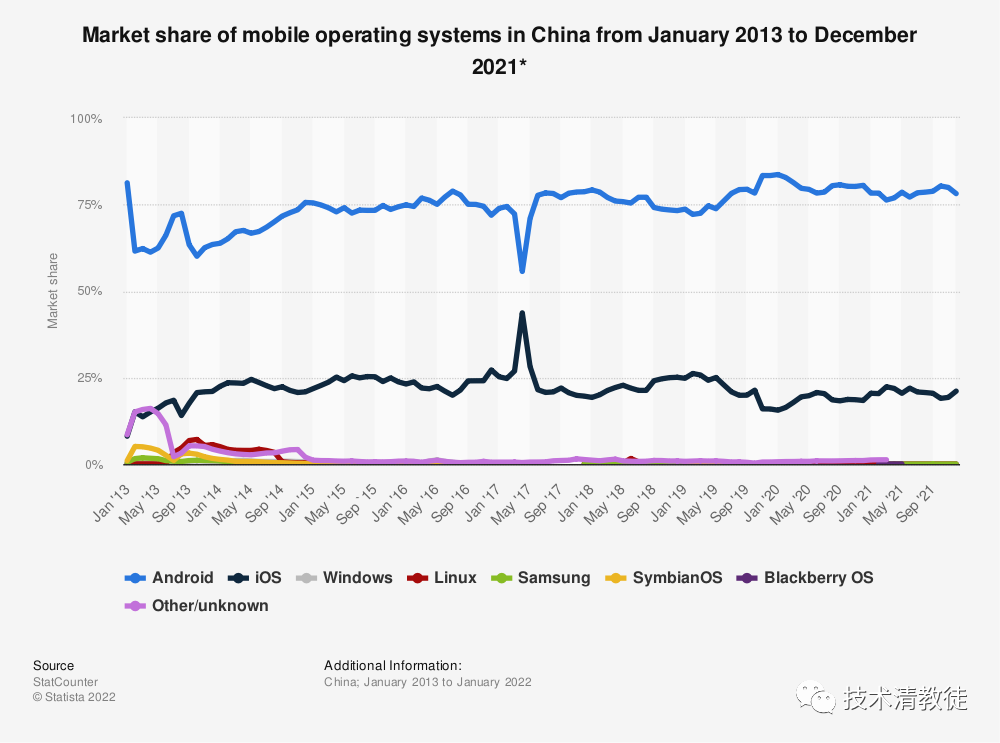
As shown in the above chart, Apple’s market share in the global smartphone industry has been maintained at around 15%. However, in North America, Apple’s market share has increased from 30% to currently around 50%; in China, it has risen from 15% to currently around 25%; and in Europe, it has decreased from 45% to currently around 30%.
That concludes our analysis of the market performance of Apple’s core products. In the next article, we will continue to quantify and analyze Apple and Tesla.
This article is a translation by ChatGPT of a Chinese report from 42HOW. If you have any questions about it, please email bd@42how.com.
