Conclusion First
My Tesla ModelY Long Range version (all-wheel drive, ternary lithium battery, Chinese CLTC standard range of 594 km, and 500 km according to American EPA standard displayed on the dashboard) was delivered on February 23rd, 2021 without an underground garage. It has been parked outdoors throughout the year, experiencing all kinds of weather. In this winter, which has just passed and saw three heavy snowfalls (November 6-7, January 21-22, and February 12-13), how much battery is lost overnight when parked outdoors?
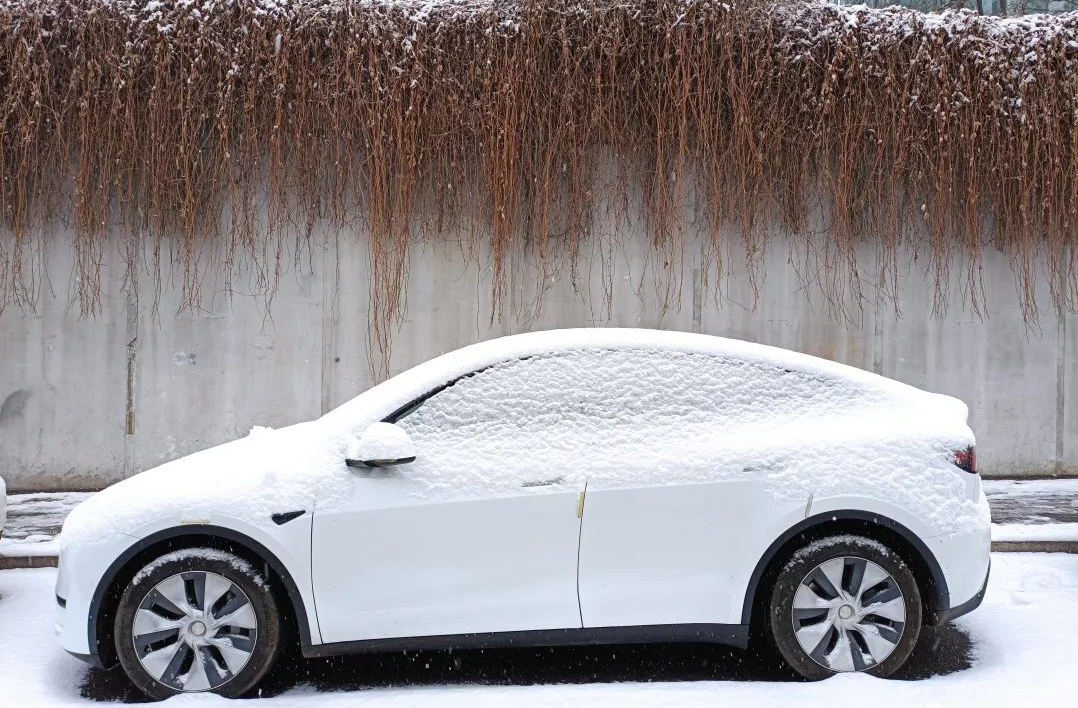
Now, let me share two most “horrible” data:
- The car lost 1 kilometer of battery in 13 hours of parking with a minimum temperature of 2℃ at night.
- The car lost 4-5 kilometers of battery in 9-10 hours of parking with a minimum temperature of -10℃ during the coldest two days in Beijing. The maximum loss of battery after a winter night of outdoor parking is about 1% of full charge, which can be ignored.
In summary: When parked outdoors overnight, the loss of battery is inversely proportional to the lowest temperature of the day in winter in Beijing. The lower the temperature, the more significant the battery loss.
I only had statistical data of my own Tesla through statistical method, which may not be authoritative but only for reference.
Statistical Method
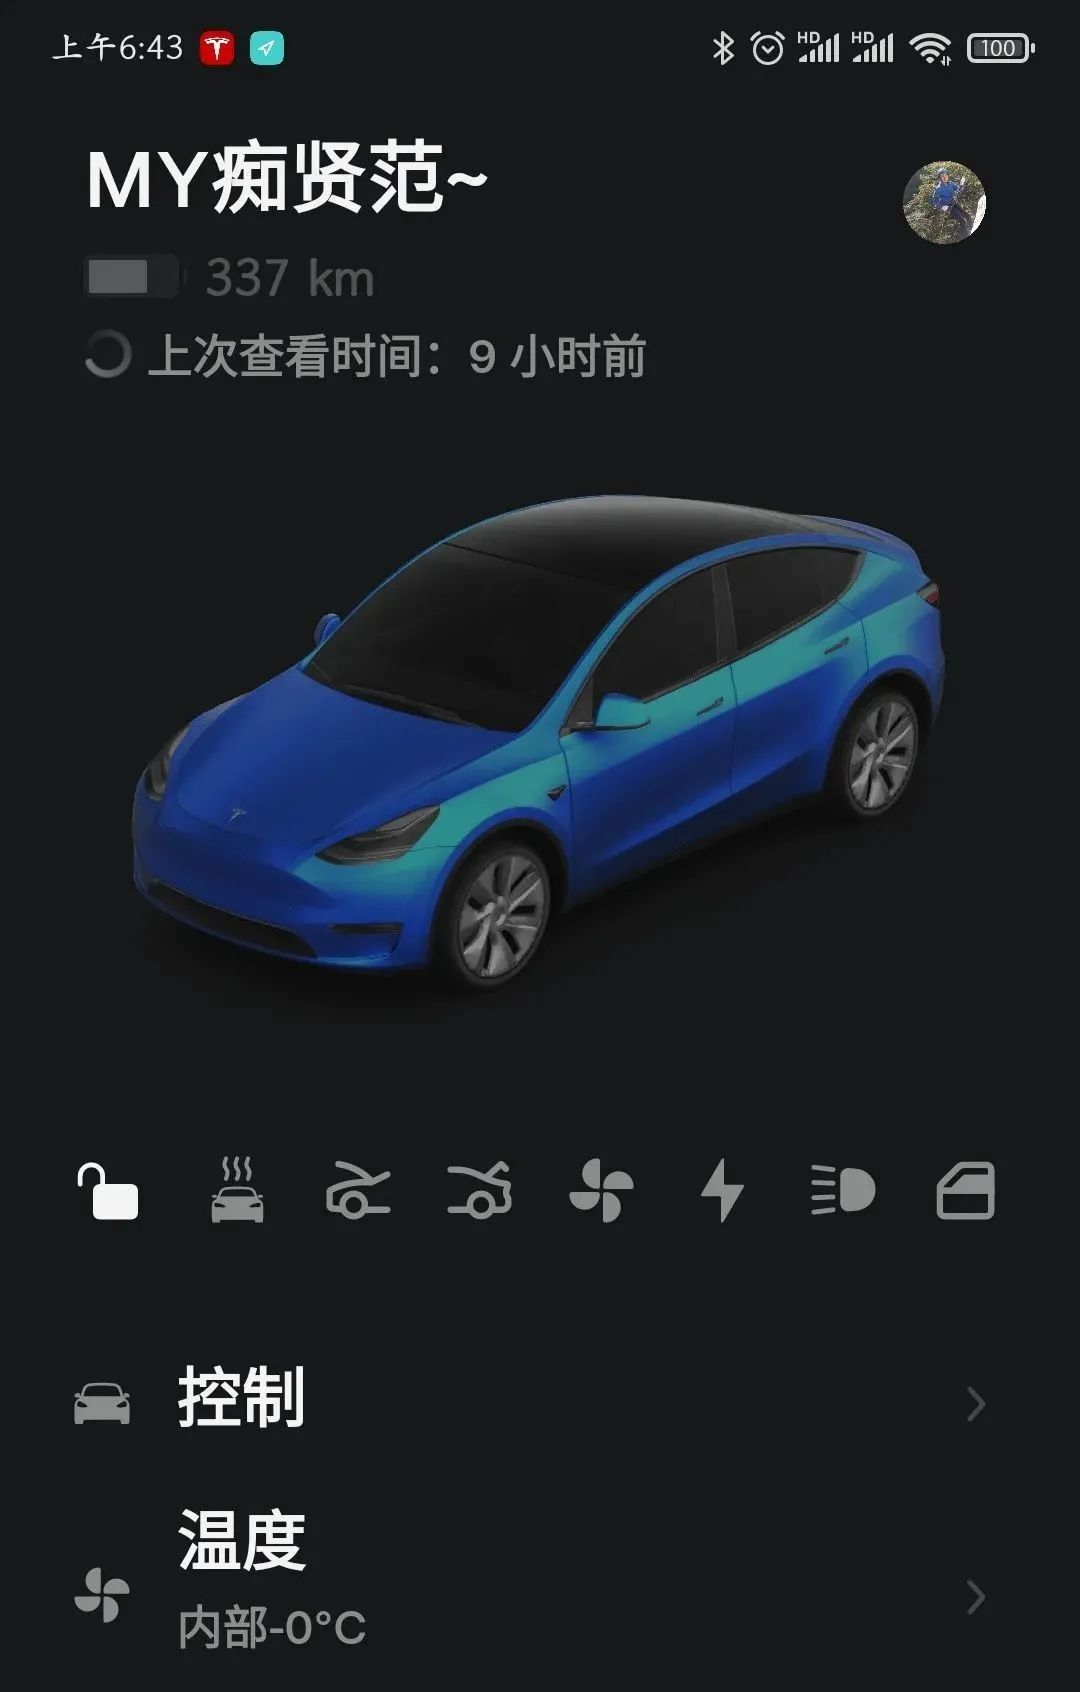
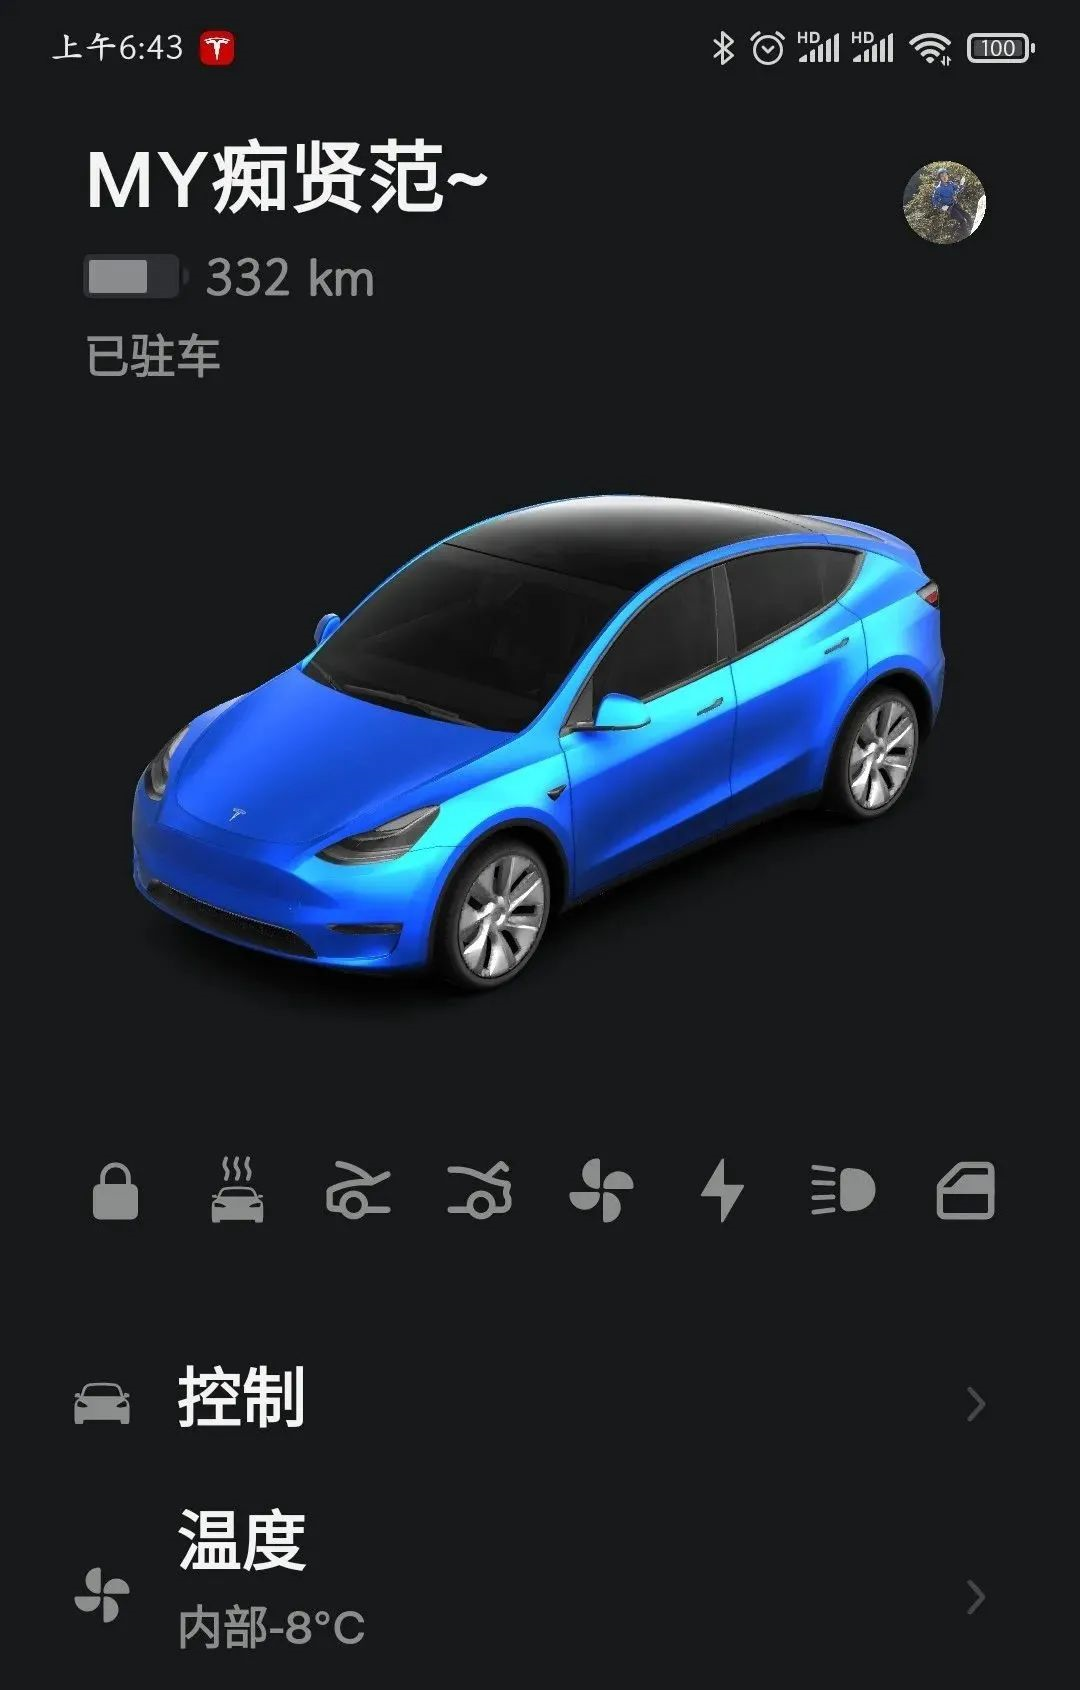
By taking February 15, 2022, as an example, I took screenshots of the APP page showing remaining distance of 337 km 9 hours before when I opened the APP at 6:43 a.m. and captured the APP page again after it was connected with the Tesla which showed remaining distance of 332 km. Therefore, the conclusion was drawn that, the Tesla lost 5 km of battery overnight from 14th to 15th of February due to outdoor parking. At that night, the lowest temperature in Beijing was -10℃ (not the temperature inside the Tesla which was -8℃).
6 Highest and Lowest Data
I have collected and analyzed the data of 22 days from November 7, 2021, to February 24, 2022, with the time span of 4 months, recording the parking period (hours), lowest temperature, remaining mileage of last night and next morning, and distance of battery loss, as shown in Table 1.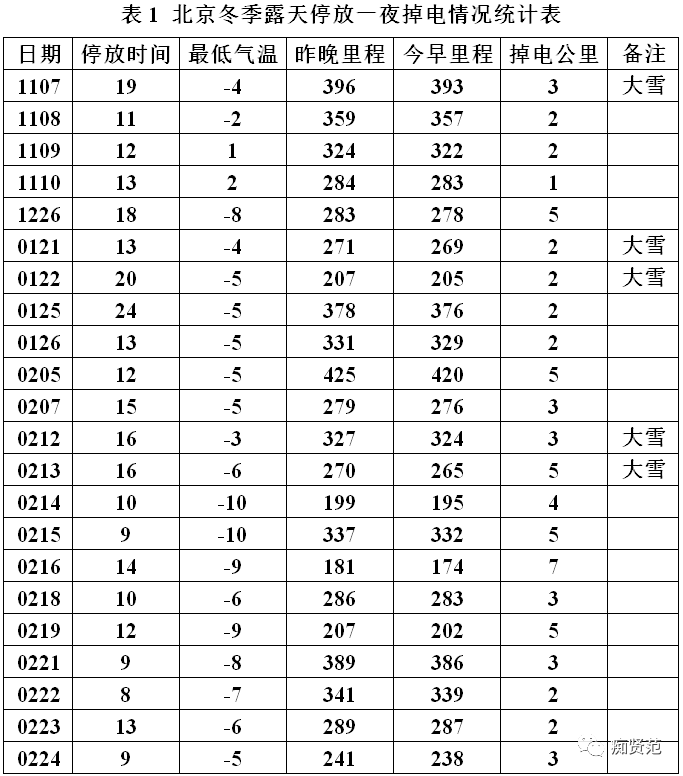
The longest parking time was 24 hours on January 25th, with a lowest temperature of -5℃, but only a 2 km power reduction!
The shortest parking time was 8 hours on February 22nd, with a lowest temperature of -7℃, and a power reduction of 2 kilometers.
The highest temperature was 2℃ on November 10th, with a parking time of 13 hours and a power reduction of 1 kilometer, which was the smallest power reduction among the 22 days.
The lowest temperature was -10℃ on February 14th and 15th (there was heavy snow on February 12th and 13th), with a power reduction of 4 and 5 kilometers after parking for 10 and 9 hours, respectively.
The largest power reduction was 7 kilometers on February 16th, with a parking time of 14 hours and a lowest temperature of -9℃.
The smallest power reduction was 1 kilometer on November 10th, with a parking time of 13 hours and a lowest temperature of 2℃.
Analysis of Three Caterpillars
These 22 days of data are illustrated by three “caterpillars”. The top blue line is the parking time curve (8 to 24 hours), resembling a blue caterpillar arching its rear legs and crawling forward. The middle green line is the power reduction curve (1 to 7 kilometers), resembling a tired green caterpillar lying on the ground. The bottom red line is the daily minimum temperature curve (2℃ to -10℃), resembling a red caterpillar hanging upside down and crawling forward.
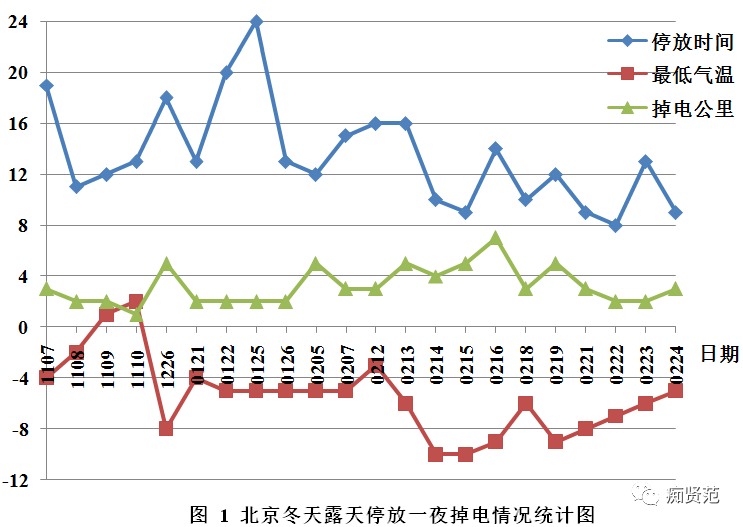
Due to the different parking times and lack of unified standards in Table 1, it is difficult to see any pattern between the minimum temperature and power reduction. All we see are three caterpillars crawling forward 🐛, and the scene is so beautiful that we dare not look 😂.
Finding the Rule
After unifying the parking time to 10 hours and recalculating, the power reductions shown in Table 2 were obtained.
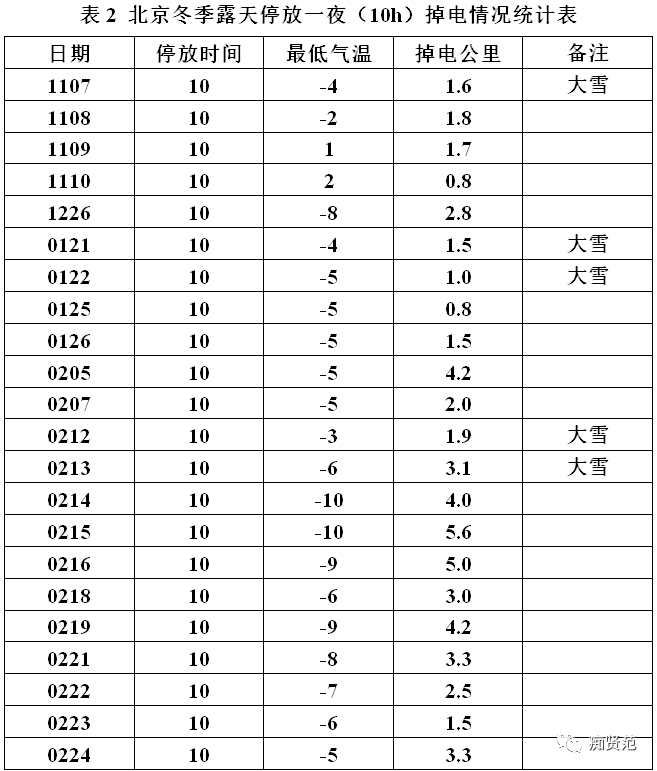
The highest power reduction was 5.6 kilometers on February 15th, with the lowest temperature of -10℃. The power reduction for an overnight stay in an outdoor environment during the winter is 1.12% of a full charge, which can be ignored.
The smallest power reduction was 0.8 kilometers on November 10th and January 25th, with the lowest temperatures of 2℃ and -5℃ respectively.
In order to draw curves more conveniently, we removed November 9th and 10th with minimum temperatures above 0℃, and took the absolute value of the lowest temperature for the remaining 20 days below 0℃, resulting in the statistical graph shown in Figure 2.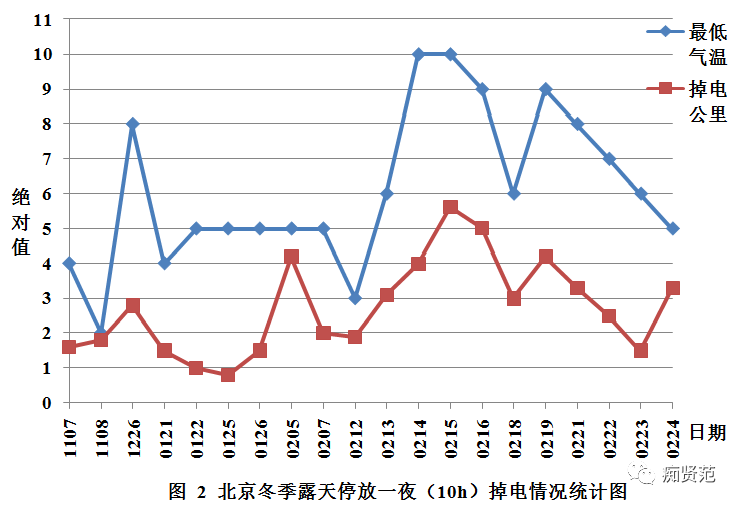
It can be observed from the statistical chart that the absolute value of temperature and the mileage loss are positively correlated: as the absolute temperature increases, the mileage loss increases, and as the absolute temperature decreases, the mileage loss also decreases. Especially in February, the V+M trend is basically the same at the turning points of high and low. It turns out that these are two blue-red caterpillars that respond to each other and synchronize perfectly!
Therefore, we can draw an important conclusion from this article: The mileage loss of Tesla Model Y parked outdoors overnight in Beijing winter (with a minimum temperature of -10℃ for 10 hours) is inversely proportional to the lowest temperature of the day: the lower the temperature, the more mileage loss after the same length of time parked.
I went on and on just to show you this? Do you still need statistics for this conclusion? It’s common sense, isn’t it? 😥 Well, let me prove that common sense also holds true for Tesla Model Y!
This article is a translation by ChatGPT of a Chinese report from 42HOW. If you have any questions about it, please email bd@42how.com.
