A few weeks ago, AVL organized a webinar titled “Hyundai IONIQ 5 The new benchmark for mid-sized sports utility electric vehicles,” which mainly analyzed the Ioniq 5 model. There were some objective information worth reading, and I have summarized it below.
I personally have high expectations for this vehicle as it represents Hyundai Kia’s transition from a 400V to an 800V system.
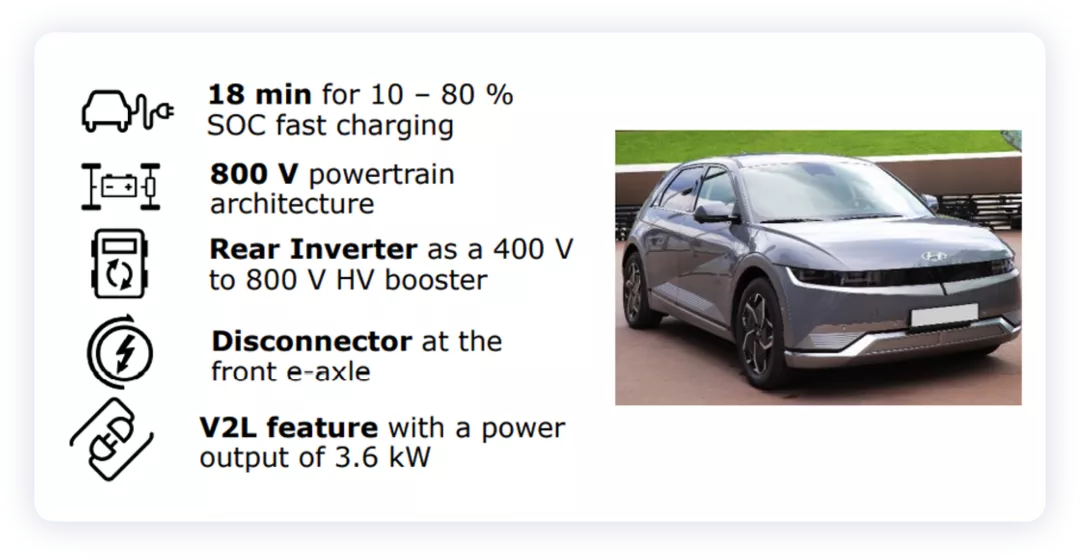
800V System Architecture and Thermal Management System (Static)
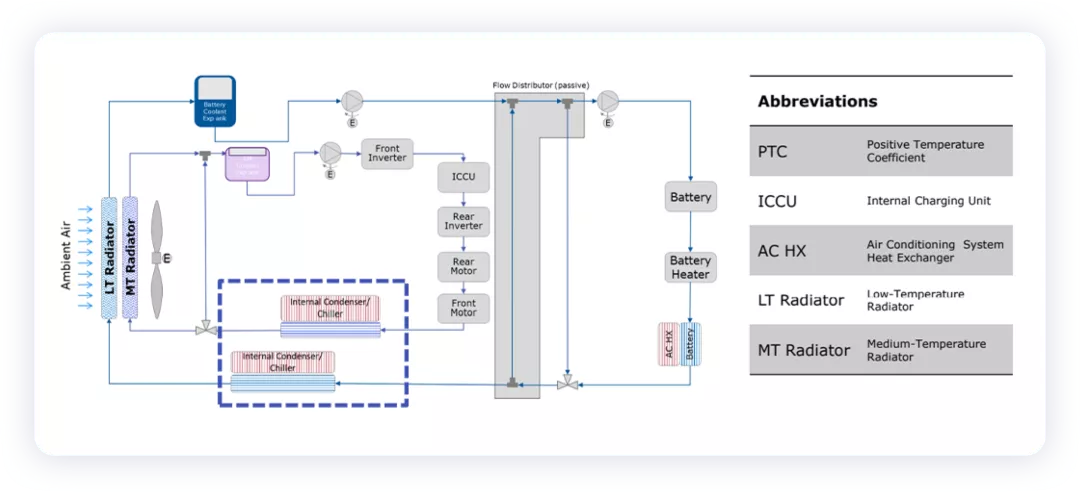
As shown in the figure below, the high-voltage system architecture of this vehicle is actually quite ordinary. The front uses a 4-in-1 (front-wheel drive system), while the rear uses a 3-in-1 (rear-wheel drive system), integrating the charging control unit ICCU, on-board charger, and DC/DC converter into one unit. Its thermal management system includes three independent air-pumped PTCs, water-pumped PTCs, and an electric compressor.

Here, the low-temperature heat exchangers have been integrated, including PT chillers and battery chillers.
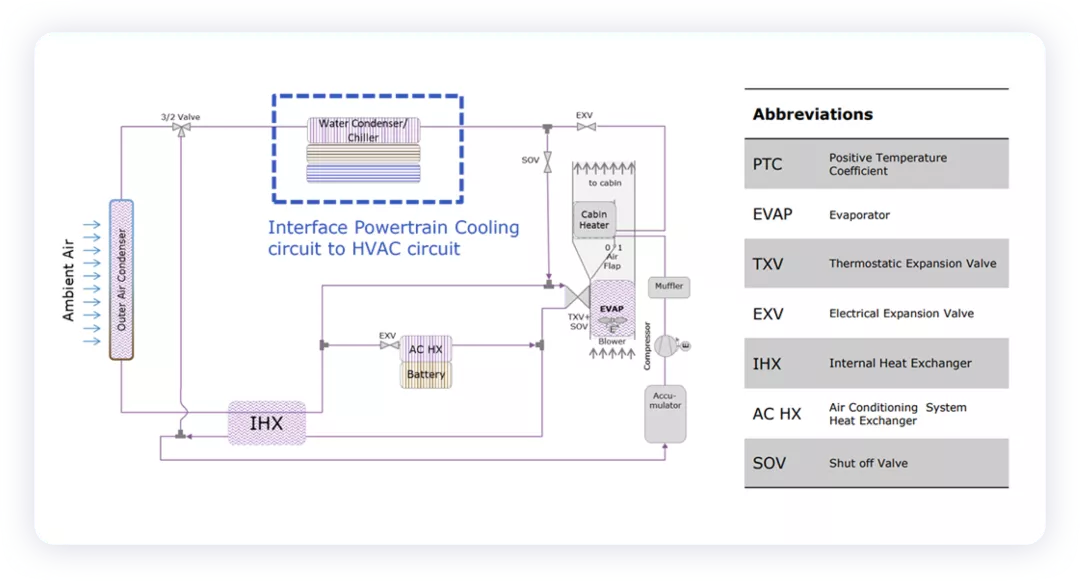
The following figure shows the cooling system schematic of the cabin and interior.
As for system efficiency, this pack’s volume utilization efficiency and weight performance are indeed mediocre, leaving considerable room for improvement.
Each individual cell weighs 750g, and the total weight of the cells is 270kg. The total weight of the pack is 453kg, which means a grouped efficiency of only 59.6%. From a volume utilization perspective, it’s not great.
The cells use an NMC 811 to graphite chemical system, and the cell energy density reaches 282Wh/kg. However, the calculated energy density of the entire pack is only 160Wh/kg.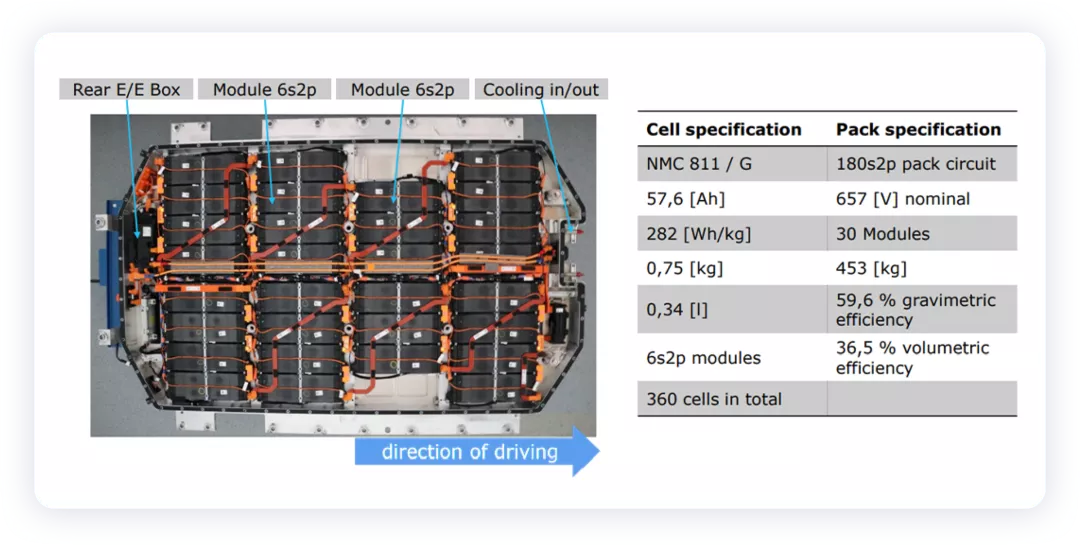
The Ioniq 5 underwent minor modifications based on the Taycan design, with the entire hot management flow path layout being completely serial, and the grouping of the modules using 2 battery cells bonded together with adhesive and one foam pad between two cells. Plastic insulating plates were used on the side panel.
Compared to the Taycan model, the design of the heat-conductive glue => module base plate => battery case => cooling plate was different. In fact, this model adopts a design that directly contacts the battery case lower tray with heat-conductive glue, which then connects directly to the water-cooled plate below.

Dynamic Testing
This part is AVL’s forte, and it is evident that a lot of effort has been put into testing this car.
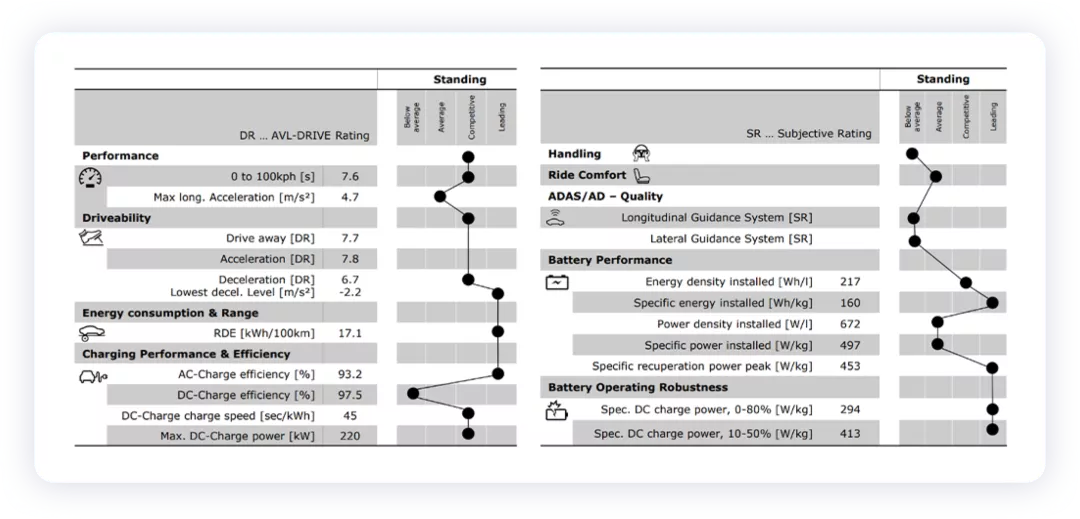
First, let’s look at the charging test. This can be compared to some of the data obtained earlier, and can be divided into several categories based on performance level:
● Below average:
This mainly includes DC charging efficiency, which may be due to the high fast charge rate demands of the cooling system; handling capability, Korean cars being tested by German institutions, including the ADAS lateral and longitudinal characteristics.
● Consistent with the average performance level:
Long-distance acceleration (the reason for this needs to be discussed further), and riding comfort.
● Competitive:
Acceleration to a hundred kilometers per hour, acceleration and braking, DC charging speed, DC charging power, battery system energy density (Wh/L).
● Leading:
Power consumption per hundred kilometers (using 800V SiC devices), AC charging efficiency (using 800V SiC devices), battery system energy density (Wh/kg, which is not very high in level), and the DC charging corresponding battery characteristics.
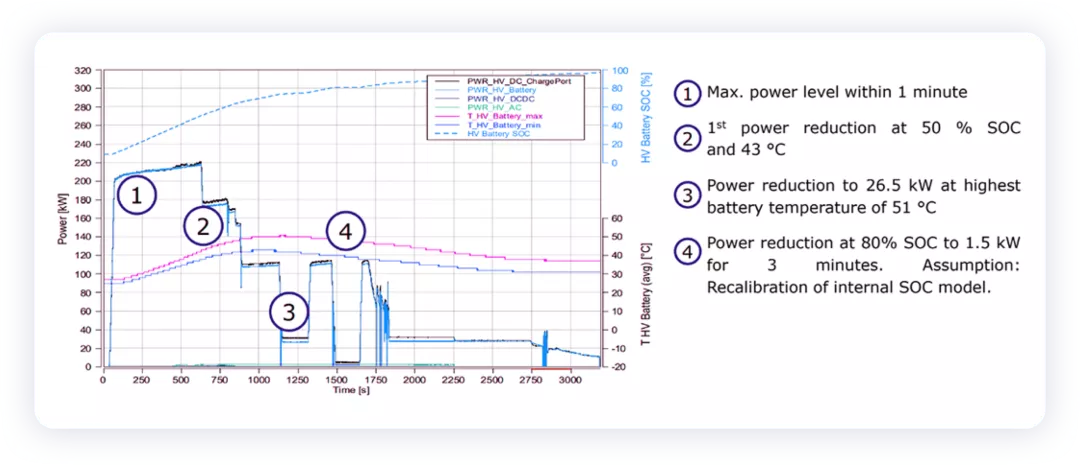
Under 25°C conditions, after driving on the highway with a 5% state of charge, the maximum power was 220kW. As shown in the figure below, it can be divided into several stages:
● Within one minute, the charging power increased rapidly to 200kW, with a maximum of 220kW;
● When the battery temperature rose to 43° and the SOC reached 50%, the charging power decreased for the first time;
● After the battery temperature reached 51°, the power decreased to 26.5kW.●When SOC reaches 80%, the charging power is reduced to 1.5kW, and there may be some corrections to the SOC calculation.

Compared with the Taycan, this car’s average charging power is not inferior, much better than Model Y, but the charging efficiency may be slightly lower, still better than Model Y.
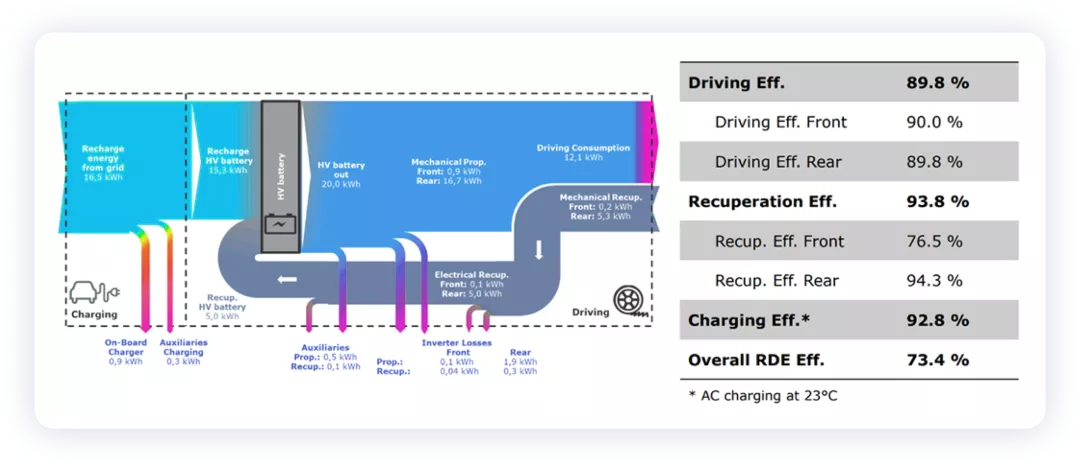
AVL has done some actual energy decomposition, which is explained quite clearly here, for reference.
Summary: This report has some other content that you can check out, and I think AVL’s benchmarking content is well worth a look, especially in terms of dynamic characteristics. They have done an excellent job.
This article is a translation by ChatGPT of a Chinese report from 42HOW. If you have any questions about it, please email bd@42how.com.