As the data of insured cars becomes available, I think it’s necessary to conduct a separate thematic analysis. Firstly, in the first part, we will sort out the overall pattern, and in the second part, we will sort out the specific pattern of car companies and car models. Actually, we can think about some questions while analyzing:
Looking at the overall data, did the retail insurance in September get greatly affected by chip supply? Have different car companies made some allocations on chips among different price ranges?
From the perspective of penetration rate, are different car companies making some adjustments and balancing?
Overview of September’s overall pattern
In September, the total number of insured cars was 1.72 million. As shown in the black line in 2021 below, starting from April, the overall market supply capacity has been fluctuating between 1.65-1.7 million. Compared with the rapidly recovering demand for passenger cars in Q4 2020, the capacity of 2 million has been achieved in September 2021, and it will be challenging to reach the demand for chips in Q4.
The cumulative insured passenger cars in 2021 are around 15.38 million. According to the estimation of 6 million in the fourth quarter, the insured passenger car data for this year is about 21.38 million.
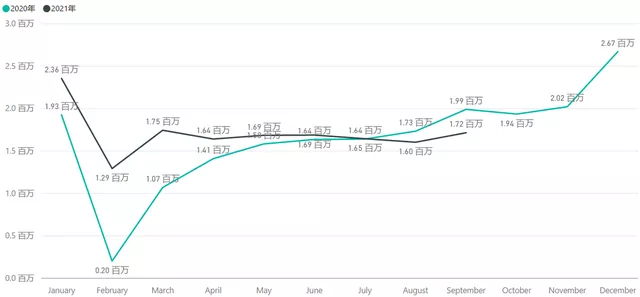
Actually, the passenger car market is not doing well this year, and the overall capacity is similar to that of 2019. If the demand for chips is still unable to meet the demand in Q4, the compressed demand in 2020 will be difficult to recover.
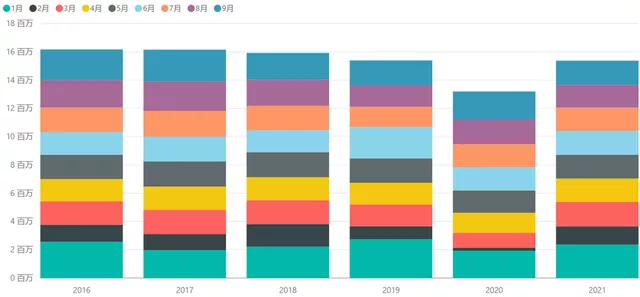
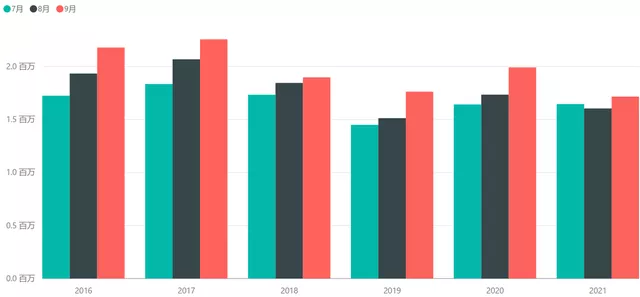
From Q3, 2021 is a very weak year in recent years, only slightly higher than the off-season in 2019, with quarterly deliveries around 5 million.
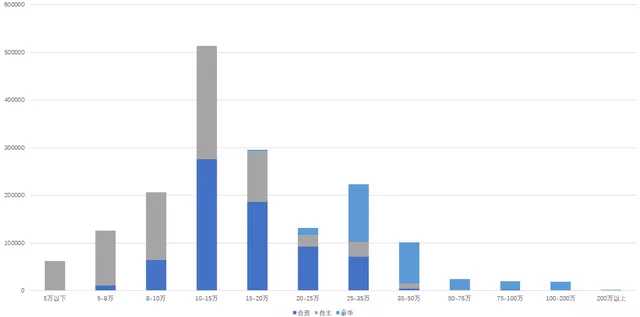
In this process, we can see that the proportion of Chinese market cars with a price of more than 150,000 yuan (discounted recently, this data has begun to have reference significance) has reached 47.38%. This shows that in the case of overall production constraints, the median price of passenger cars is forced to rise.
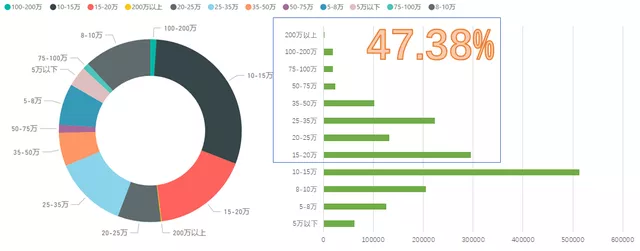 In the process of chip competition in the car industry, there are certain considerations as to what needs to be preserved. Currently, various enterprises are still focusing on a quota-based approach.
Analysis of the Penetration Rate of New Energy Vehicles
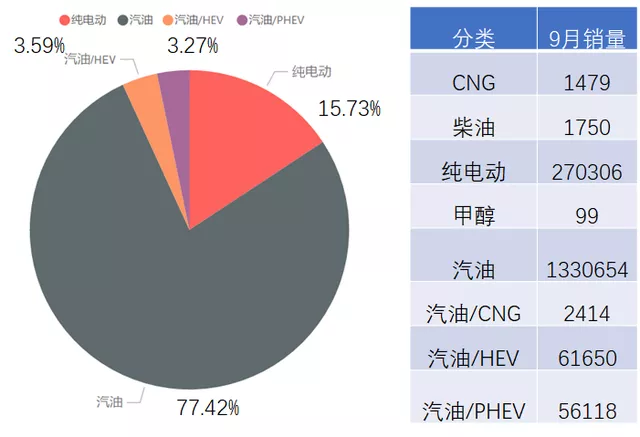
In September, the insured number of pure electric vehicles was 270,000. The penetration rate of BEV (Battery Electric Vehicles) has exceeded 15.73%, with 5.6 thousand PHEV (Plug-in Hybrid Electric Vehicles) and a penetration rate of 3.27%, and 3.59% for HEV (Hybrid Electric Vehicles).
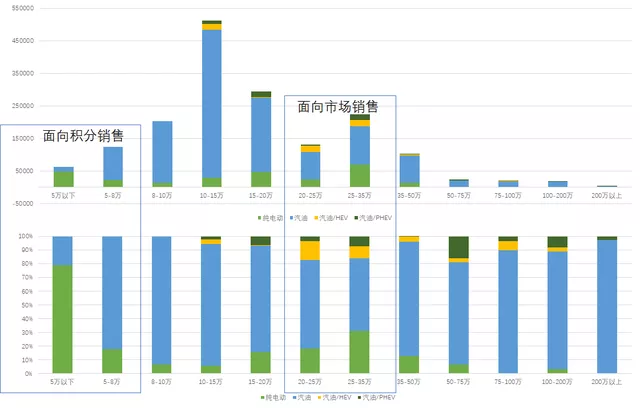
However, if we carefully examine the penetration rate, the A00 level under 50 thousand RMB and the 5-8 thousand RMB segment have penetration rates of 80% and 20% respectively. Only with the leadership of the A00 level brand can absolute dominance be achieved. The main territory for the 2B model is the A level, which accounts for about 18%, and this is mainly revolving around the replacement of public gasoline vehicles. The segment where the effective improvement is most significant is still the 200,000-250,000 RMB and 250,000-350,000 RMB segments. As Tesla’s data for August was incorrect, if we compare the data for these two segments, we can see that Tesla has gained a greater market share in this niche market, but without Tesla, pure electric vehicles in China have also achieved a solid position.
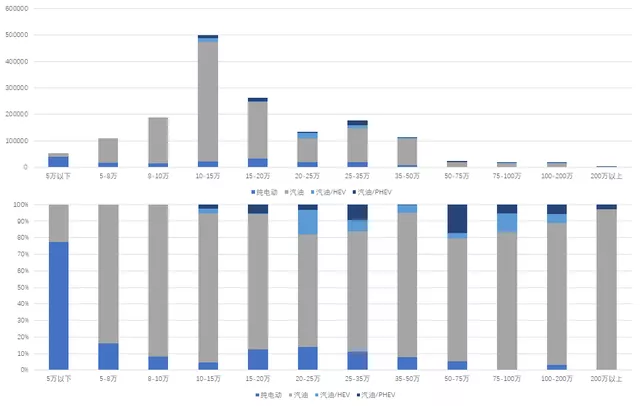
Comparing the differences between the two months, the main area of difference is Model Y’s 250,000-350,000 RMB segment, where Tesla’s market share reaches 30% and without Tesla, it remains at around 10%. The Model 3’s impact has already ended, which means that even if the price continues to drop in the future, it won’t significantly affect the development of new energy vehicles.
This article is a translation by ChatGPT of a Chinese report from 42HOW. If you have any questions about it, please email bd@42how.com.