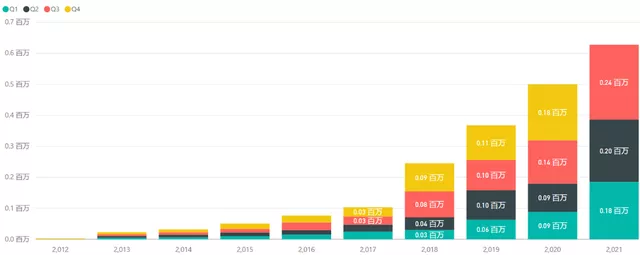
Tesla released its Q3 production and delivery figures yesterday, which set a new quarterly record. In Q3, the company delivered a total of 241,000 vehicles, up 73% year-over-year and 20% quarter-over-quarter, breaking the previous record for quarterly deliveries and adding 40,000 units from the previous quarter.
Breaking it down, sales of the Model 3/Y were 232,025, up 87% year-over-year and 16% quarter-over-quarter, while sales of the Model S/X were 9,275, up 391% quarter-over-quarter.
From the production side, Q3 production was 238,000, up 64% year-over-year and 15% quarter-over-quarter, adding 31,402 units. Model 3/Y production was 228,882, up 79% year-over-year and 12% quarter-over-quarter, and Model S/X production was 8,941, up 282% quarter-over-quarter.
It’s worth noting that Tesla’s approach to business is starkly different from other automakers. In the third quarter, a long-standing chip shortage led to declining sales in the U.S. for General Motors, Honda, and other automakers. GM’s U.S. sales fell nearly 33% in Q3, marking its lowest level in more than a decade.
The article raises the question: from where are all these cars being produced, and where are they being sold?
Meanwhile, the Chinese market has continued to thrive as announced by BYD, which sold 184,483 units in Q3, of which the vast majority were sold within China.
Where are Tesla’s cars being sold?
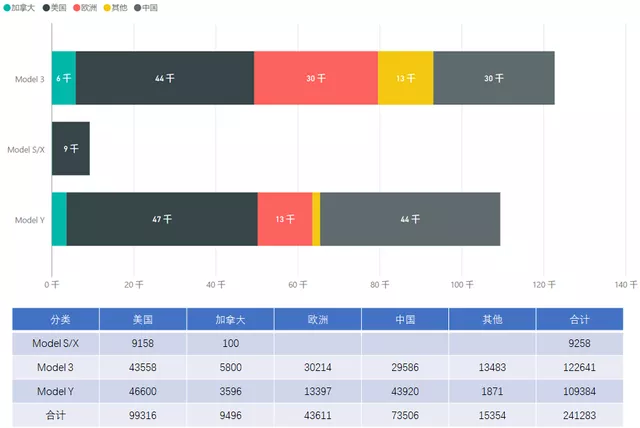
Where are Tesla’s cars being sold? It’s difficult to estimate based on July and August data, but Troy Teslike’s conjecture is worth noting. Based on the following data, Tesla’s cars are broken down as follows:
United States: 99,361 units; according to Troy, there were extremely low levels of inventory at the Fremont factory. Plus, nearly 10,000 units were sold in Canada, making for a total of around 110,000 vehicles in North America.
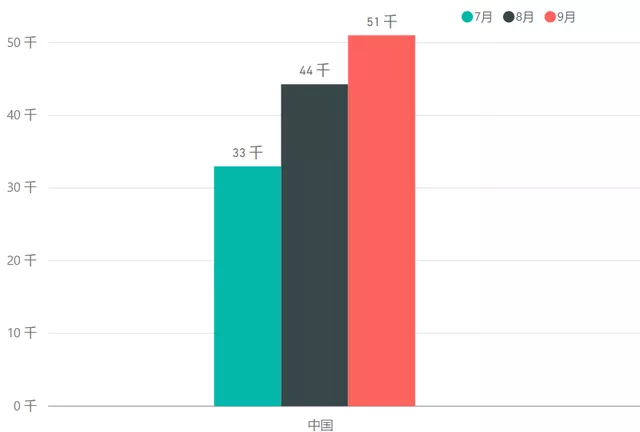
China: 73,506 units. We’ll dig into this data later.
Europe: 43,611 units. Adding up July and August figures (13,802 units), and given this data, it’s possible that September deliveries could reach 29,809 units.
Other: This category includes Japan, Korea, Australia, and other global regions, totaling 15,000 units.
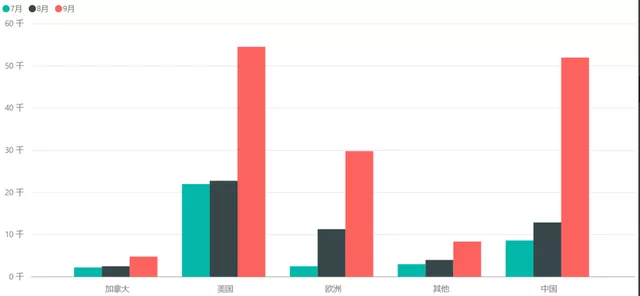
 If we break down the data by month, it should be this, which means that the United States went from 20,000 to 50,000 all at once. Due to the Aragon laboratory, we can roughly estimate Tesla’s sales in the United States by removing other models from the monthly sales of 28,000.
China also follows this logic, rising from the previous thousands to 50,000. After the insurance data errors last month, studying distribution areas has brought more difficulties.
Note: These data can be verified later, but the current data providers have already begun to slip up. This is too much of a shame.
Where is it made?
According to Troy Teslike’s data, China’s production has reached 128,234 units, surpassing the United States’ 113,066 units.
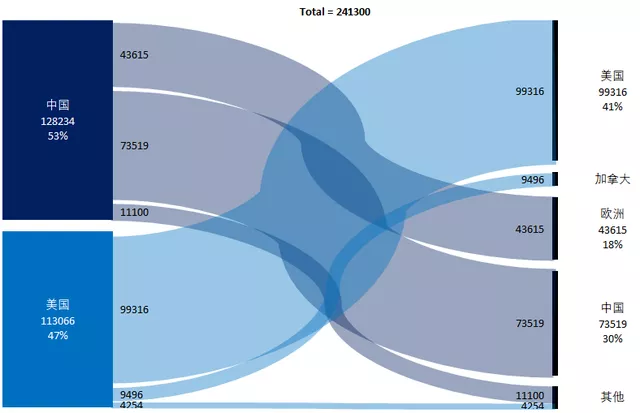
In this sense, Tesla’s maximum output in China has exceeded 51,000 units, not far from the previously understood maximum weekly output of 20,000.
Conclusion: Writing so much, a large part of it is based on Troy’s data analysis. Interested parties are facing significant difficulties in obtaining accurate data, as data providers are not very reliable. Some securities analysts have asked for my opinion, so I took the time to organize it over the holidays. This may help everyone understand the delivery situation, and we will look at the European data next week.
This article is a translation by ChatGPT of a Chinese report from 42HOW. If you have any questions about it, please email bd@42how.com.