Continuing from yesterday’s article (“Overview of New Energy Vehicle Insurance in China in July”), if we want to carefully study where the new car companies are selling their cars and what the real situation of each company is, we need to analyze them from the features of a group of companies to individual ones.
Today’s article is divided into two parts, first providing an overview and then looking at each company separately. In this wave of new energy vehicles’ development, everyone can have their own opinions and perspectives, and I am constantly revising my own ideas. The focus is to visualize the evidence and perspectives and gradually verify them.
Overview
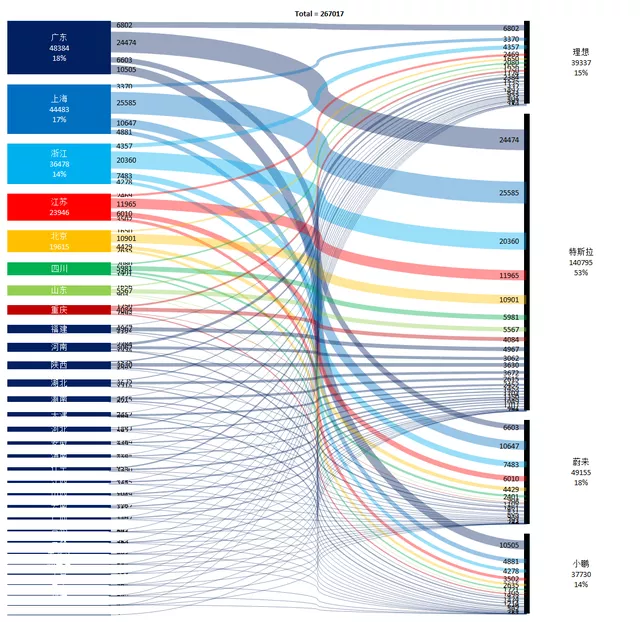
New energy vehicle manufacturers (Tesla, NIO, Li Auto, and XPeng) rely heavily on the five regions of Guangdong, Shanghai, Zhejiang, Jiangsu, and Beijing. In other words, 70% of the sales of the three purely electric vehicle manufacturers are from three affluent provinces and two municipalities, while the distribution of Li Auto’s cars is relatively uniform in terms of region.
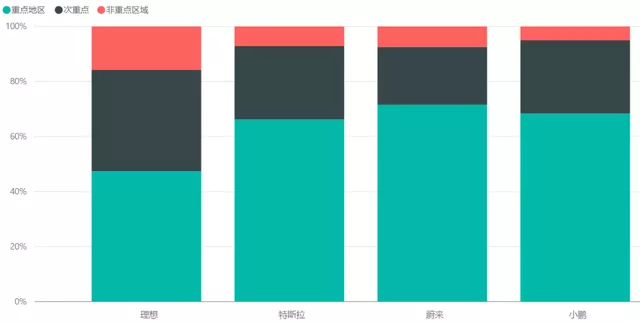
The following chart presents a different way of showing the concentration of regional sales, which may give everyone a more intuitive understanding. We can see key areas where various brands sell well (Guangdong, Zhejiang, Shanghai, Jiangsu, and Beijing), as well as some secondary areas where each brand performs well. Then there are non-focused areas where sales performance is generally average.
In the key areas, Guangdong (48,384), Shanghai (44,483), Zhejiang (36,478), Jiangsu (23,946), and Beijing (19,615) had sales of 20,000 to 50,000 units in seven months.
In the secondary areas, sales start with Sichuan, and from highest to lowest are Sichuan, Shandong, Chongqing, Henan, Fujian, Shaanxi, Hubei, Hunan, Tianjin, and Hebei. Sichuan has the highest sales of 12,183 units, and Hebei has between 4,128 and 12,183 units. Compared to Figure 1, the proportion of the four car manufacturers’ sales in these regions is between 25% and 36%.
In non-focused areas such as the northeast, northwest, and central regions (Anhui, Hainan, Liaoning, Jiangxi, Yunnan, Guangxi, Shanxi, Guizhou, Geelyn, Heilongjiang, Inner Mongolia, Gansu, Ningxia, Xinjiang, and Qinghai), except for Li Auto, the sales of the other three companies account for only 5%- 7%; Li Auto is better, accounting for more than 15% of the distribution.
In these non-focused areas, the selling point of Li Auto ONE is the compatibility with fueling for extended range. In fact, part of the reason behind this is that there is still a vast area in China with no particularly good charging infrastructure, as seen in the image below.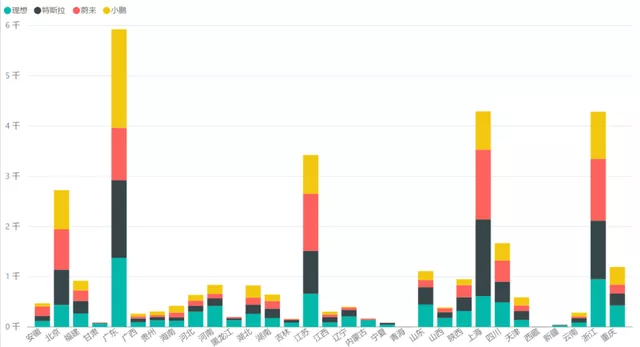
By Enterprise and Region
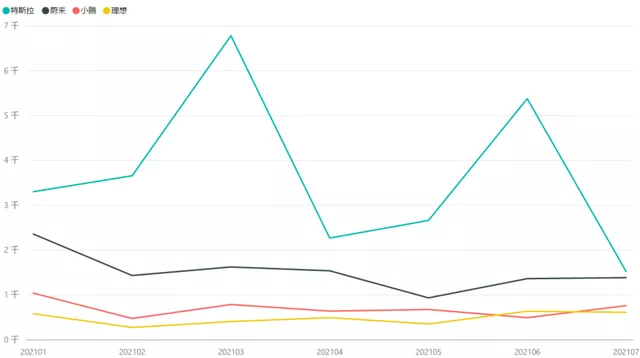
I took out the data for July alone and made some maps based on the car companies by sales region. Comparing Figure 1 and Figure 2, we can see that there was not much change in the regional distribution in July as compared to the first seven months of the year.
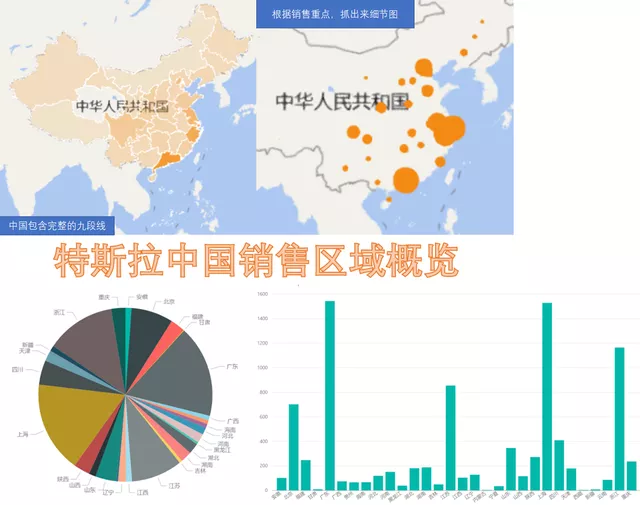
- Distribution of Tesla sales regions in July
Tesla’s distribution has always been stable in these regions. From January to July, we didn’t see Tesla effectively penetrating the previous key regions. You can check how to explain the fluctuations in July delivery data.
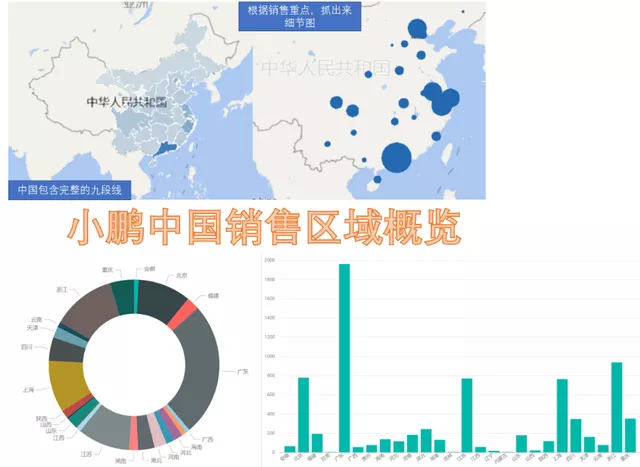
- Distribution of XPeng Motors’ sales regions
XPeng Motors sells more in its home field of Guangdong Province, and its situation is the same as the other three BEV companies in other regions.
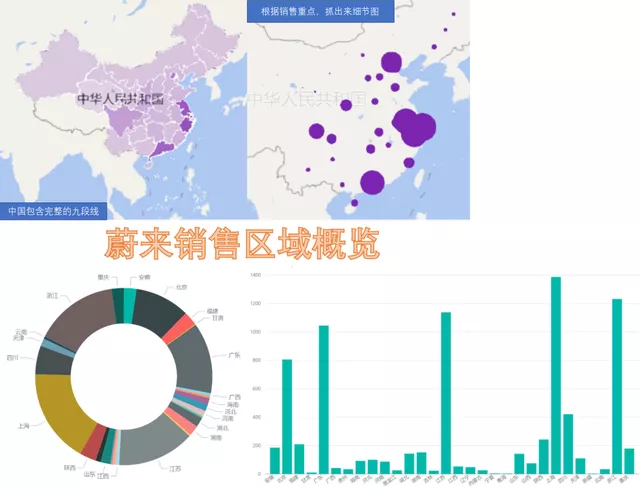
- Distribution of NIO sales regions
NIO’s situation is similar. It is a half-home field in Shanghai, and its incremental growth in second-tier cities is currently limited. NIO is currently the highest-priced car, and it does have more sales in affluent regions.
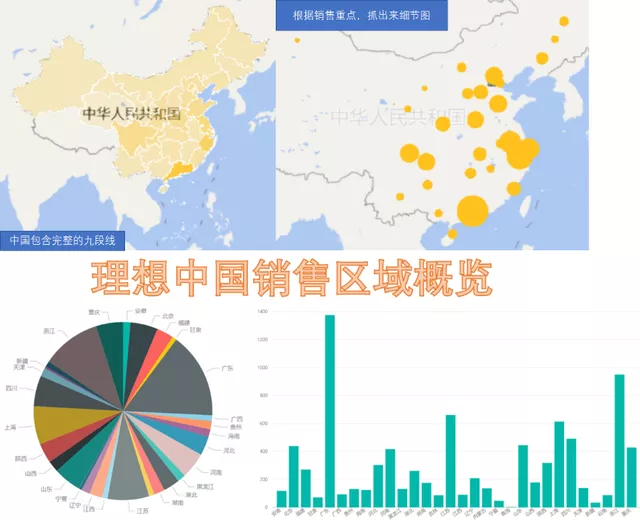
- Distribution of Ideal sales regions
Among these companies, Ideal has the most special situation. It has a lot of users in Northeastern, Western, and Central China. In a sense, this is an advantage in terms of range. In these regions, the sales of pure electric vehicles are somewhat limited, and the 6-seater large SUV range technology and traditional plug-in hybrid technology are completely different. This makes the distribution of Ideal more like that of a traditional large car. I will do a separate analysis of Ideal’s situation later.
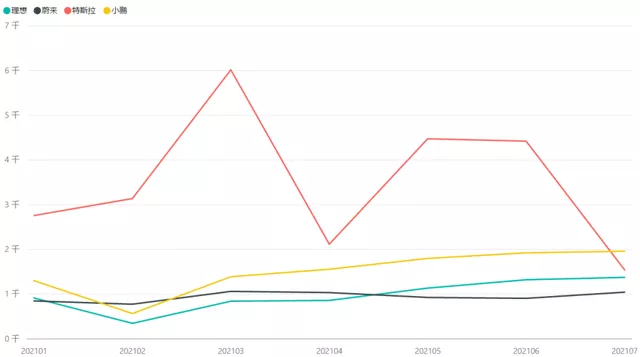
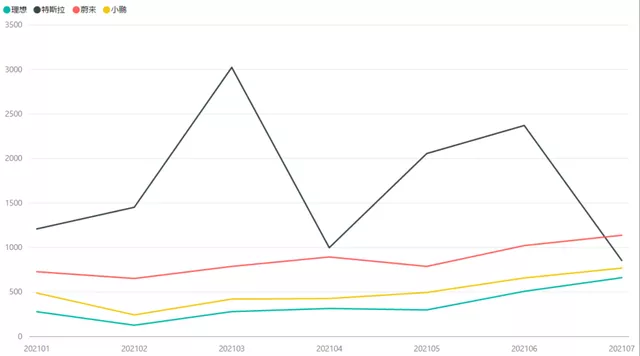
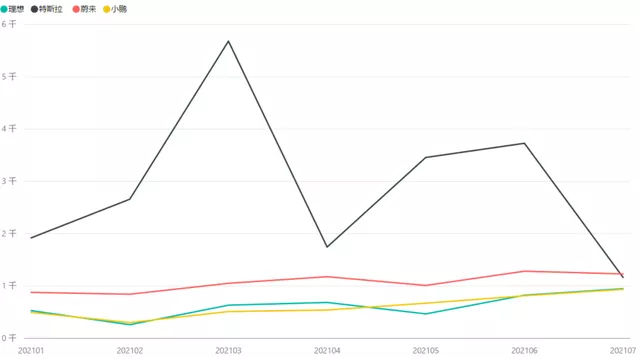
- Looking at some key regions again from a regional perspective: Shanghai, Guangdong, Jiangsu, Zhejiang, and Beijing.I believe the current situation with Tesla is still worth paying attention to. This year, there was a significant gap between Tesla and other brands in terms of sales volume in Shanghai. However, this gap is gradually narrowing, and there is a limit to competing for market share simply by reducing prices, especially in restricted purchase cities like Shanghai.
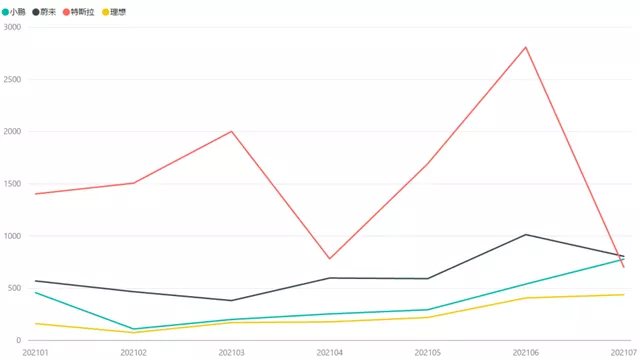
In Beijing, Ideal is viewed as competitive with gasoline cars (of course, without road restrictions), and its sales have gradually climbed to almost 500 vehicles. This is an interesting phenomenon.
In summary, this is where I will stop analyzing today. It is possible to further analyze the situation of each company at the city and county levels. Currently, electric vehicles are penetrating more quickly in affluent areas. Of course, the restrictive purchase policy has played a significant role, directly driving nearly 70% of sales for new car manufacturers. We saw a concentrated sales phenomenon in specific regions in Q3 and Q4 of 2020, and this trend continues in the same regions from January to July this year. However, whether electric vehicles can continue to grow in more regions and when they can do so, we may need to look to other car manufacturers for answers.
This article is a translation by ChatGPT of a Chinese report from 42HOW. If you have any questions about it, please email bd@42how.com.