Summary of Insurance Data for Passenger Cars
Today, I received the simplified version of China’s domestic car insurance data for July. The overall number of insured passenger cars for the month was 1,645,572, which is exactly the same as last year’s figure, 1,641,644.
Let’s first review the overall situation for July. Once the more complete data becomes available, we can then examine the sales distribution of new energy vehicles in the three months leading up to July.
Overview of Passenger Car Insurance Data
The cumulative insurance data for 2021 shows 12.058 million, as illustrated in the chart below. A comparison with 2019, when the first seven months accumulated to 12.12 million, reveals a similar trend for this year.
Starting in May, the number of insured passenger cars has remained steady. One reason for this lies in the seasonal nature of automotive consumption during the summer, when the market typically experiences a lull. In addition, there is the issue of a systematic reduction in supply caused by the shortage of chips among joint venture automakers. If we use the 2019 trend to forecast the total for 2021, the number of insured passenger cars is expected to be around 21 million.

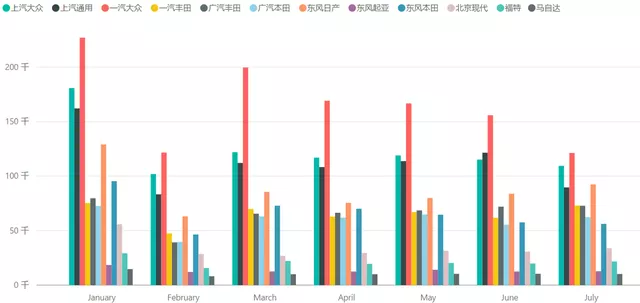
The supply of chips has a major impact on joint venture automakers, which is the core reason why many of their monthly insured car data has been declining since April. There are many ways to address this chip supply issue, such as purchasing speculative products and passing them on to suppliers to bridge the gap. Emergency switching to different chip platforms is another option. And of course, there are plans to use domestically produced chips. However, these are not particularly feasible solutions for joint venture automakers.
Note: FAW-Volkswagen’s insured numbers exclude Audi, which accounts for only 58,000 units this month.
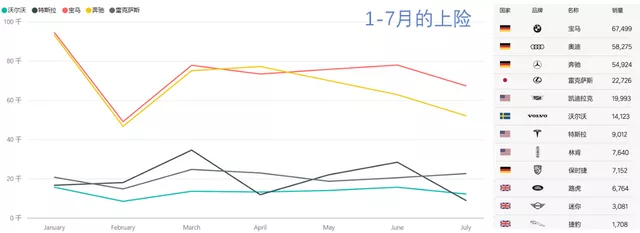
Looking at foreign luxury brands, the overall trend shows a decline throughout July.
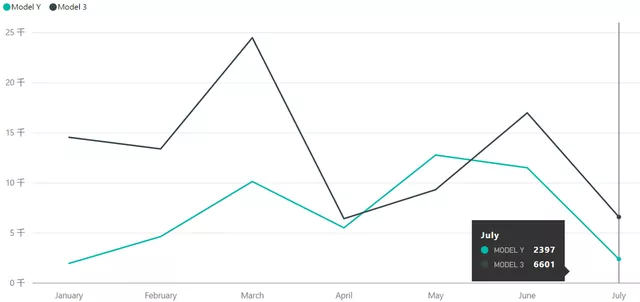
Everyone is concerned about Tesla, and I myself was discussing this issue on Zhihu yesterday. The number of insured Tesla cars in China in July wasn’t particularly high: 2,397 for the Model Y and 6,601 for the Model 3, for a total of 8,998. What does this data mean? My hypothesis is that:# Tesla is deliberately guiding changes in the domestic order pool:
On August 8th, Tesla released the Model Y Standard Range version with a huge price difference, causing many consumers to give up the existing Model Y version and wait for the Standard Range version. This caused the domestic order pool of Model Y, which was more than 300,000, to dry up before the delivery of the iron-lithium version of Model Y provided by CATL. And since the increase in orders for Model 3 was not fast due to the comparison between the two cars, coupled with the price reduction of Model Y at the beginning of the month, the price reduction of Model 3 at the end of the month was a normal response to accelerating the accumulation of orders, so the combined data was only 8,998 units.
Some opinions on Zhihu believe that exports caused the insurance amount to be less than production, believing that Tesla exported more than 24,000 cars. Due to the high number of orders in other regions and the limited order pool in China, the first month of the quarter gave priority to delivery to foreign countries.
In fact, regardless of the reason for this gap, compared with the domestic demand in Q1, Q2, and July, we can see that the overall demand for new energy vehicles in China has been on the rise. However, Tesla’s deliveries in China are flat or even decreasing. Compared with the demand in January, April, and July, it is lower than the overall month-on-month growth rate of new energy vehicles.
Domestic car companies
In terms of the total number, domestic brands were also lacking chips in July, but overall supply was relatively stable, which cannot be separated from the continuous efforts of various car companies in the supply chain. Basically, the supply of chips of each car company is directly managed by the highest level in supply chain management.
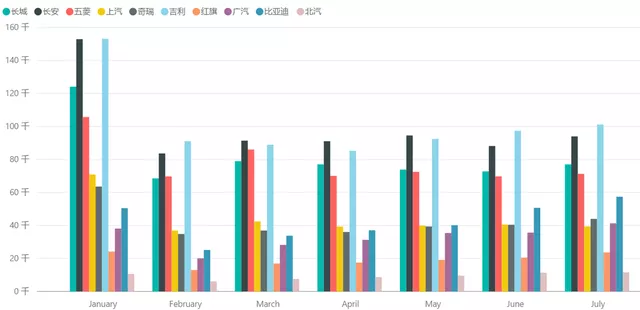
In the current situation, BYD’s performance is very eye-catching. As shown below, after a peak in January, BYD’s gasoline cars gradually stabilized at around 15,000 insurance data (in May, 17,000 gasoline cars were produced, and the production volume of gasoline cars decreased to 8,601 and 8,862 in June and July, respectively, and the focus has been shifted to PHEVs). From the perspective of DM-i, it is to replace its own gasoline vehicles. Judging from this month’s data, BYD BEV’s insurance data is around 20,000, and PHEV’s insurance data breaks through 20,000, with a big climb: from 2,302 units in February to 19,205 units, nearly a tenfold increase in July.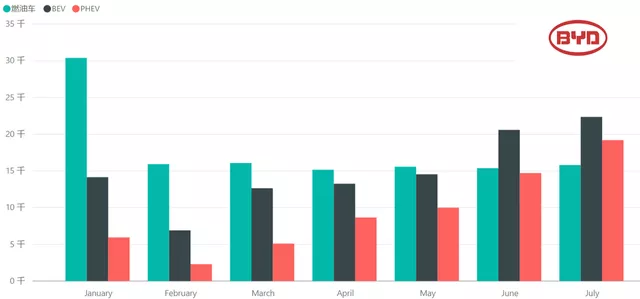
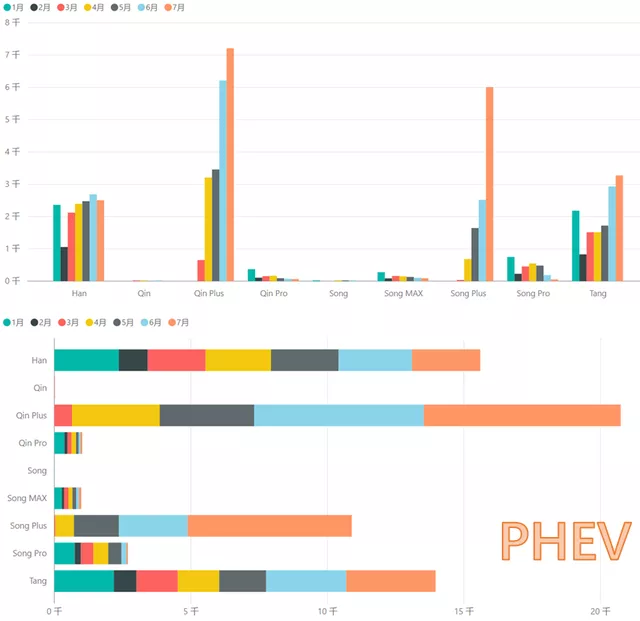
In PHEVs, the DMi has completely replaced the original DMp. Currently, the monthly insured amounts for Qin Plus and Song Plus have reached 7K and 6K respectively, totaling 1.3W. However, Han and Tang are still maintaining around 2.5K, and the increment is still on Qin DMi and Song DMi.
Note: I believe the main issue with the DM-i’s development lies in whether it will differentiate the demand for BEVs. In other words, according to the current sales distribution of DM-i, it is accelerating its expansion towards the second-tier market. The sales logic is a fuel-efficient and powerful hybrid vehicle (can be used without charging environment).
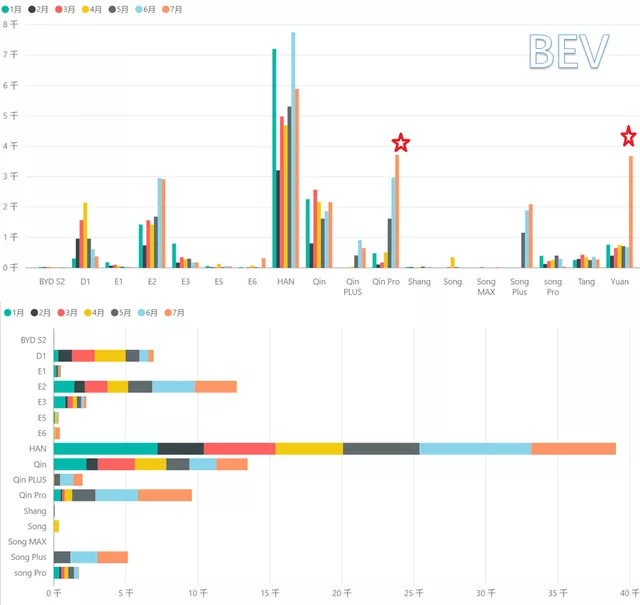
The overall insured data for BYD’s BEVs is currently maintained at around 20,000 units. The major increment in July was in the “Yuan EV” after its price reduction. As Han EV begins to enter normal sales of 4-5K, BYD is returning to the familiar pattern. It should be noted that it will be hard for D1 to have a breakthrough in quantity in the future. Currently, the combination of Qin, Qin Pro, Song Plus, and Yuan EV still dominates, and only E2 on E Net is purely electric.
There is also something worth noting that with the import of BYD’s lithium iron phosphate battery blades, its SoC upper limit and lower limit can be relatively open, without the need for some reservation like the current tri-element. Therefore, its current solution is highly evaluated among 2B vehicles. The product competition and the actual degradation rate of the endurance are quite competitive, which is a surprising conclusion for the current lithium iron phosphate solution. We used to worry that the lithium iron phosphate would suddenly crash due to low SoC misidentification.
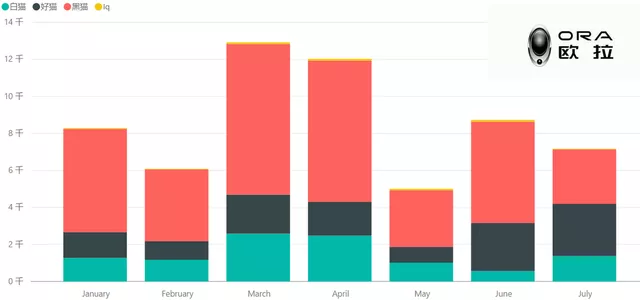
Next, let’s analyze the insured data of Great Wall separately. Currently, Great Wall’s Euler new energy is prioritizing the protection of Good Cat. The insured numbers in July were 7171 units, and the systematic impact of chip problems on Great Wall may not pass until two months later.
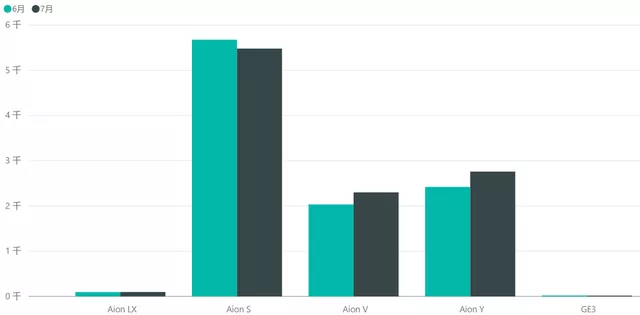
 The sales volume of GAC Aion New Energy Vehicle has remained stable during this period, despite the continuous stimulation from XPeng Motors, which is just around the corner.
Summary: When discussing the distribution of sales of new and joint venture vehicles in future articles, I would like to focus on the topic. In recent months, the penetration rate of new energy vehicles has skyrocketed, which is indeed based on the overall limited supply. However, starting from 2022, the priority of supply for new energy vehicles will continue to increase. Nevertheless, the overall price of passenger cars, both domestic and joint venture, will continue to rise by optimizing out low-price fuel vehicles.
This article is a translation by ChatGPT of a Chinese report from 42HOW. If you have any questions about it, please email bd@42how.com.