Lithium-Ion Battery Supply Chain for E-Drive Vehicles in the United States: 2010–2020
Argonne National Laboratory has released an in-depth analysis of the changes in the U.S. battery supply chain titled “Lithium-Ion Battery Supply Chain for E-Drive Vehicles in the United States: 2010–2020”. The report provides detailed insights that are useful for readers. In 2010, the U.S. began selling electric vehicles, but at that time, the domestic production of battery cells was very low. With the establishment of the Giga Factory model by Tesla in 2018, 70% of battery cells produced in the U.S. between 2018 and 2020 were domestically produced. The trend of U.S. automakers building new battery super factories (including GM-LG Chem and Ford-SK Innovation joint ventures) is becoming more and more apparent, and these battery companies in the U.S. are also purchasing base battery materials globally.
Regarding battery systems, automakers initially assembled battery modules and systems themselves, allowing the U.S.’s pack domestic production rate to reach 87%.
Note: The report discloses that China’s battery cell manufacturer, CATL, is building its first overseas plant in Germany and is considering a U.S. factory.
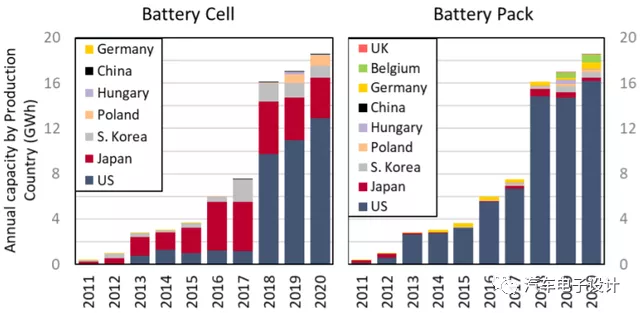
Historical Stock of Batteries in the U.S. Market
Statistics from the new energy vehicle market in the U.S. from 2010 to 2020, divided by production location, show a demand of approximately 75.9 GWh over the ten-year period. The total amount of domestically produced electric vehicles in the U.S. was 65.8 GWh, and a total of 67.4 GWh of battery packs were assembled in the U.S. The difference in battery packs was assembled elsewhere and sold in the U.S.
Note: This data shows that some of the new energy vehicles in the U.S. are still exported.From the perspective of battery cells, the United States has produced 39.1 GWh of battery cells domestically, while Japan has exported 26.8GWh and South Korea has exported 7.7GWh. However, it is estimated that the demand for batteries in the United States will reach 80Gwh by 2023. This is also the core reason why the minerals and resources for battery production are currently in short supply. This round of demand comes from Europe, the United States, and the three major markets are all growing. HEV batteries are also included in the statistics here. The US market’s annual demand for HEV batteries is approximately 400 MWh. Panasonic supplies more than half of the batteries, followed by LG Chem, Blue Energy (GS Yuasa), and Vehicle Energy Japan (Hitachi).
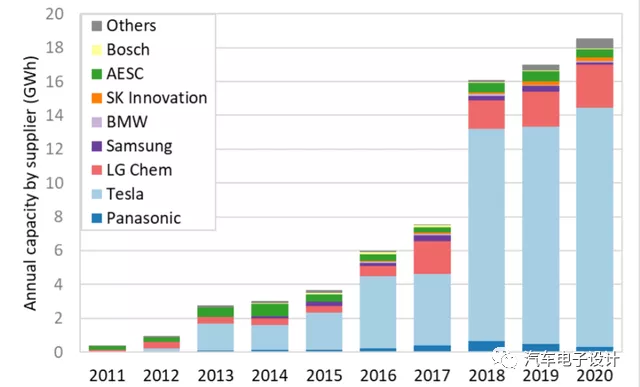
In terms of quantity, since 2018, starting with the explosive sales of Tesla, Panasonic has dominated the major demand in the US market, with sales of more than 200,000 vehicles per year. LG Chem comes in second with an annual scale of about 70,000.
Starting in 2018, Tesla has steadily purchased 13GWh of batteries from Panasonic annually, while LG’s supply in the United States is between 2-4GWh.
We can see that in the Pack manufacturing field, Tesla actually occupies an absolute dominant position. In terms of innovation in foreign pure electric battery systems, Tesla’s design and its manufacturing iteration are inseparable. Among car companies, except for BMW’s Pack assembly, no other company has specially engaged in Pack production.
Note: General Motors’ Volt series produces its own Pack, but for the Bolt EV, LG takes care of the Pack.
Supply relationshipThe following pictures are very interesting. I think in the future, I will also display the supply relationship of China according to this format. The two pictures below depict the supply relationship in terms of MWh and the number of cars, respectively. The distinctive feature of these pictures is that they depict the scale of supply clearly, and by comparing the two, the huge difference in the amount of electricity carried by PHEV and BEV can be clearly seen.
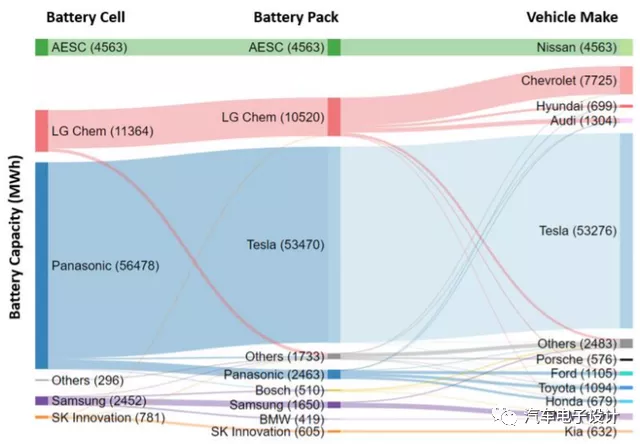
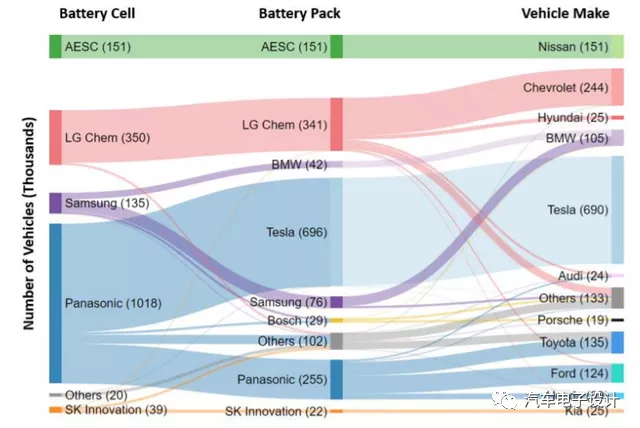
Conclusion: There are some interesting supply relationships in this report, which I think have been done well. If I have time, I will select some valuable content for your reference. That’s all for now.
This article is a translation by ChatGPT of a Chinese report from 42HOW. If you have any questions about it, please email bd@42how.com.
