By: EatElephant
This article is based on the analysis of several technical sharing videos by Karpathy, and the data and screenshots are also from the videos. The author has added their own interpretations, so it may not be entirely accurate. If there are any errors, please feel free to point them out and discuss.
FSD Overview
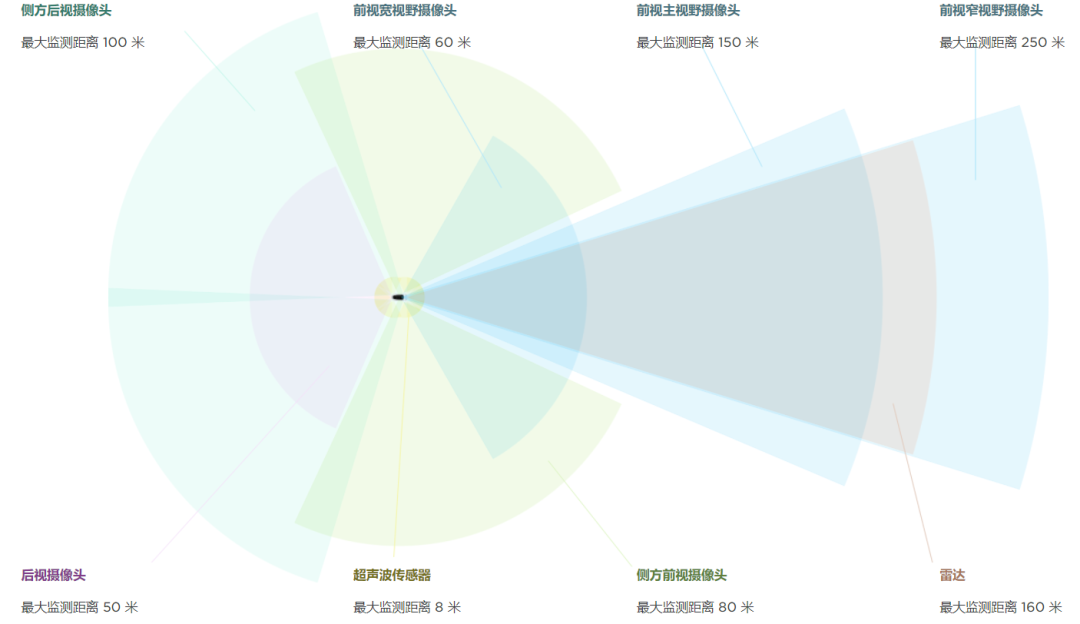
FSD is equipped with 8 cameras, each of which captures 960×1280 three-channel images at a frequency of 36Hz (the camera parameters mentioned by Karpathy are just for illustration and may not be the actual camera specs used by Tesla). Using the images from all 8 cameras, FSD performs perception predictions for over 1000 different tasks (the data statistics are for the first half of 2020 and may have increased since then).
All of these perception functions run on Tesla’s self-developed FSD Computer, which has two redundant FSD chips. Each chip provides 72TOPS (int8) of computing power, and the two chips provide a total of 144TOPS of computing power. The built-in high-speed image processing module can theoretically support the transmission of 1080P images from 8 cameras at a frequency of 60Hz. Its computing power is higher than that of other high-end autonomous driving chips on the market, such as Xavier and EyeQ5.
According to the news at the end of 2020, Tesla will soon update the forward millimeter-wave radar to a highly-resolute 4D millimeter-wave radar to improve detection capabilities for static barriers.
FSD currently includes more than 1000 detection tasks that cover a wide range, including but not limited to over 50 main tasks in the following categories:
- Moving Objects: Pedestrian, Cars, Bicycles, Animals, etc.
- Static Objects: Road signs, Lane lines, Road markings, Traffic lights, Overhead signs, Cross-walks, Curbs, etc.
- Environment Tags: School zone, Residential area, Tunnel, Toll booth, etc.## Model Architecture
To perform such complex perception tasks, Tesla has made a lot of considerations in choosing the neural network structure.
Single task network vs Multi tasks network


Loosely coupled heads vs Tightly coupled heads
Loosely coupled means that each camera perceives separately, and the perception results of different cameras are stitched together using filters or other techniques, for example, the 1.0 version of Smart Summon used this approach to stitch together the detected curbs from different cameras to obtain the Occupancy Grid map of the parking lot for navigation.
In addition to perception tasks, FSD also trains many functional networks, including but not limited to the following 48 subnetworks:
-
Depth Network: used for dense depth estimation
-
Birdeye View Network: used for coordinate projection from image to Birdeye view
-
Layout Network: used to infer the layout of road elements
-
Pointer Network: used to predict the correlation between road elements, such as traffic lights corresponding to lanes
Furthermore, FSD will transform sampling-based outputs into raster-based outputs. The difference between the two is that sampling-based outputs come from sampling of determined geometry, while rasters can represent uncertainty. More uncertainty means more diffused output.“`
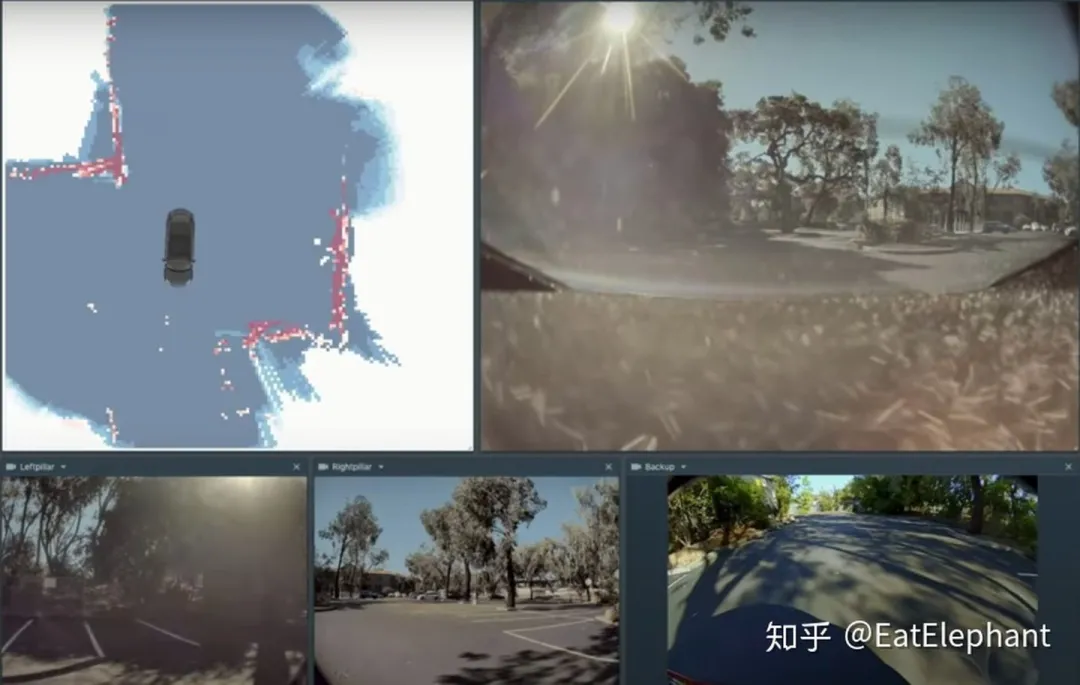
However, tracking different grids between different cameras and frames is challenging. In the new version of Smart Summon, Tesla adopts a Fusion Layer to fuse the Feature layers from different cameras for Birdeye View Network, and then branch into different heads for outputs such as Object Detection, Road Line Segmentation, and Road Edge Detection.
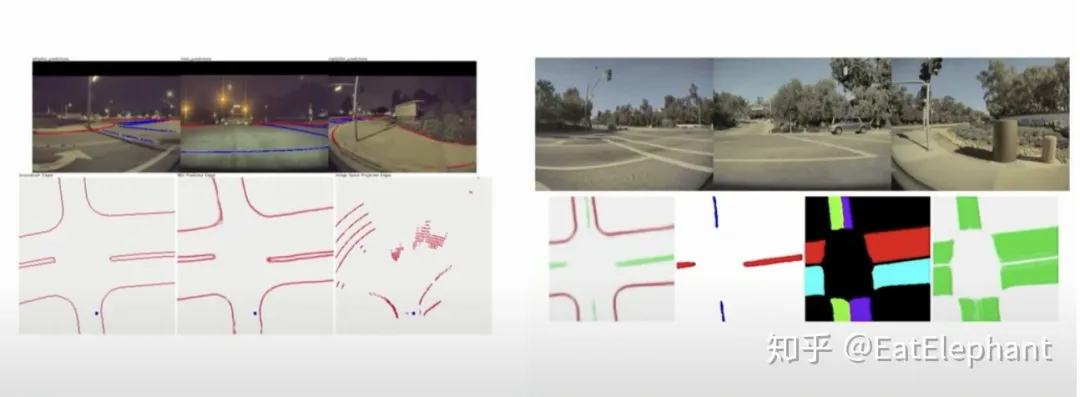
Finally, the FSD uses a large-scale Multi-head network, where the backbone network adopts a ResNet-50-like architecture for Feature extraction, and the functional branches use a structure similar to FPN/DeepLabV3/UNet to achieve different functional outputs.
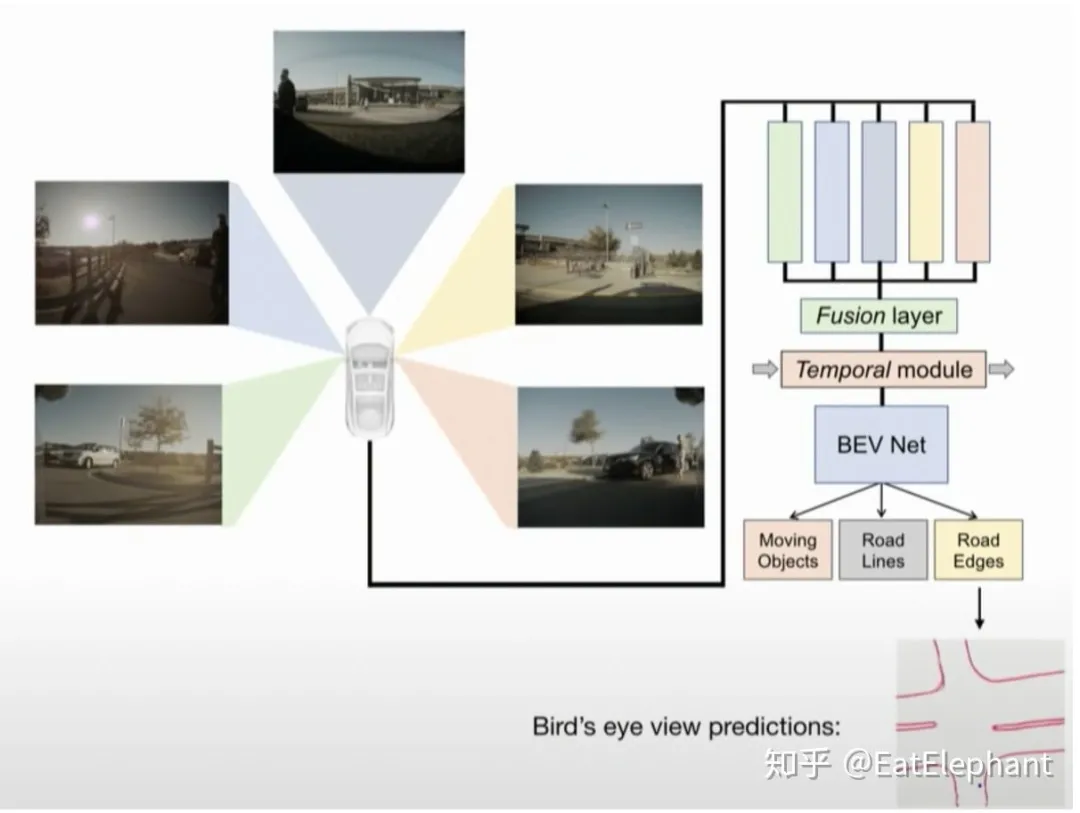
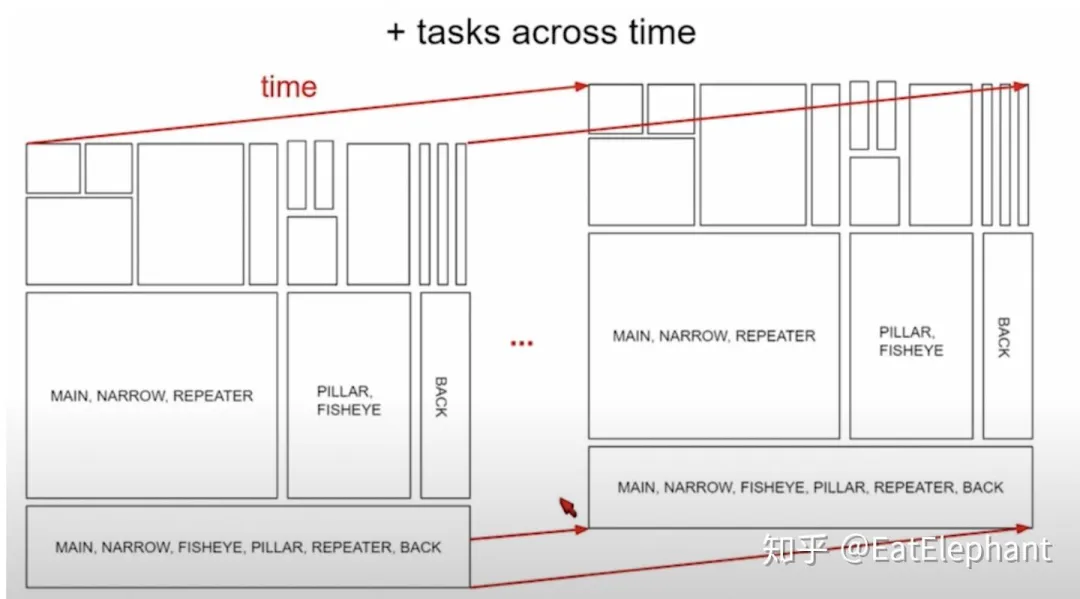
“`The final network architecture of FSD consists of a shared Backbone and a multitask HydraNet with numerous functional Heads, as shown in the two images above. Different cameras are responsible for different functions, and the network introduces an RNN structure for temporal perception and prediction. For example, the feature of the forward 3 cameras, Main+Narrow+Fisheye+Pillar camera, is responsible for lane detection and tracking, while the output of Pillar+Fisheye and past time is responsible for Cut-in detection. The hierarchical structure of cross features for different functions sharing in different cameras is designed based on promoting the observation of their respective tasks, while hierarchical structures shared between some tasks will also affect each other, which should be avoided. For example, dynamic objects and traffic lights should not share too many low-level features, but lane detection and drivable area should share more low-level features. Karpathy also mentions some interesting phenomena he discovered during training. For example, using the loss of 5 tasks at the same time to train part of the network can obtain better features, but the trained network will only be used for inference of three tasks among the five.
Training
Training such a large multi-task model with 48 networks and over 1000 perception outputs is very difficult. One single training requires 70,000 GPU hours, not to mention the iterative process of model training, tuning, and optimization. Although Tesla has developed a special Dojo Computer for training to improve efficiency, the training process is still filled with various challenges.
Loss Function
In the huge HydraNet, all the Heads of the sub-tasks are finally integrated into a Loss function by weighted averaging, and the training process optimizes this integrated Loss function. The weights of these different sub-tasks are hyperparameters of this model.
In academic research, there are methods to find the optimal weights of sub-tasks automatically. However, when the number of sub-tasks expands to hundreds or thousands, such automatic methods become impractical.
Ultimately, the selection of these sub-task weights becomes a hyperparameter that requires careful consideration and cannot be changed easily once determined. Selecting these hyperparameters requires considering many factors, such as:
-
Different tasks have different Loss scales, and classification and regression also require different weights.
-
Different tasks have different priorities, for example, pedestrian detection has a higher priority than speed limit signs.- Some tasks are relatively simple, while others are more difficult. For example, the changes on the signs are not significant, and the model can quickly train to achieve good results. However, the distribution of lane elements is challenging to locate.
-
Long-tail task data is very rare (such as detection data for non-standard vehicles, accidents, etc.).
-
Some task data has a lot of noise.
In order to achieve good performance of the model in all tasks, it is necessary to adjust the weights of different tasks reasonably. Once the weights of different tasks are determined, task tuning should be performed under the determined weights, rather than frequently changing the weights, which may cause the performance of other tasks to decline.
Training Across Different Tasks
Because the model shares parameters to different degrees between tasks, when training some sub-tasks with different data, the entire network model will not be trained, but a part of the overall network will be trained according to the task and data sample, as shown in the figure below.
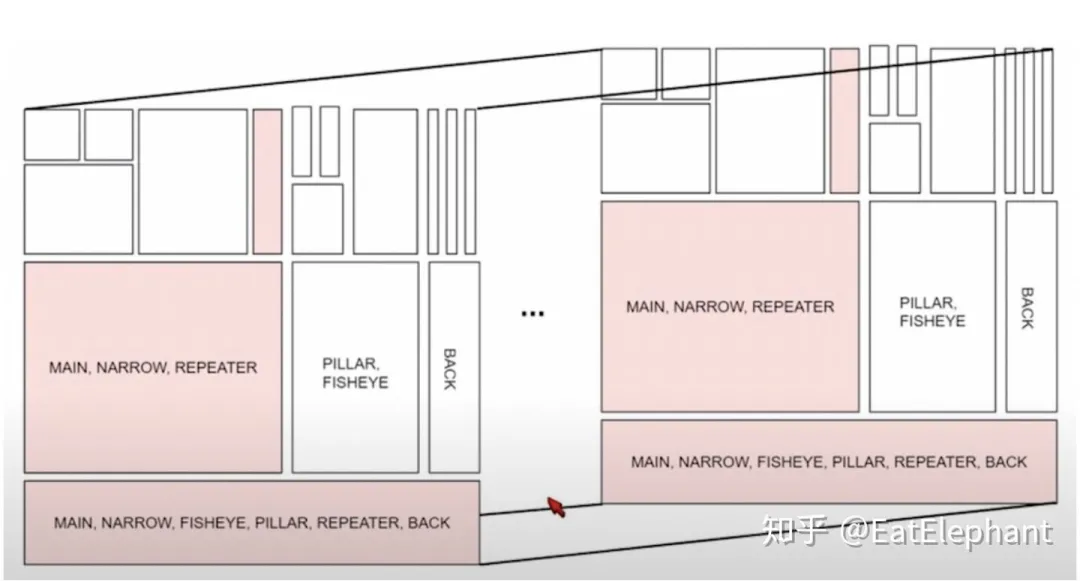
To avoid the impact on other tasks during the training of partial networks, a method similar to freezing part of the parameters in Transfer Learning can be adopted.
Data Balance
To solve the training of long-tail tasks, Data Oversampling is used to ensure Data Balance within and across tasks. The following figure shows the schematic diagram of Data Oversampling in the traffic light detection task:
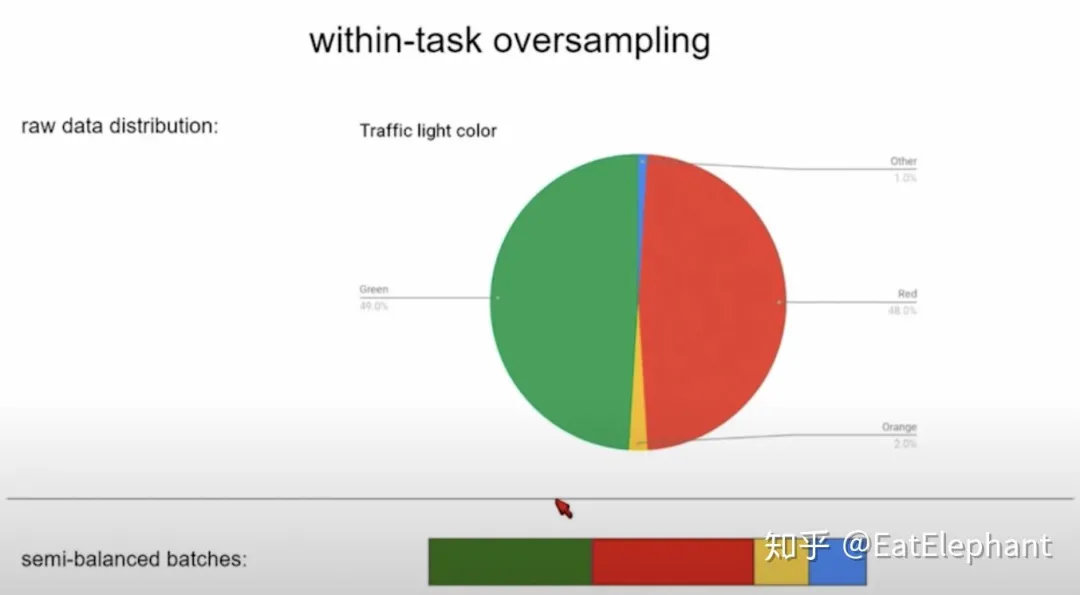
In actual traffic light data, yellow and blue lights indicating passage are very limited. However, excessively imbalanced data will make it very difficult to train a model that correctly recognizes these data. By oversampling, the basic data distribution can be balanced in a task.
In addition, oversampling rates are set for different tasks to adjust the performance of different tasks based on different task priorities and importance.
HyperparameterExcept for hyperparameters such as oversampling rates and task loss weights, the complexity of different task heads and the regular methods are also important parameters for hyperparameter tuning. For example, for tasks with different data sizes, a smaller head should be used for long-tail and noisy tasks to avoid overfitting.
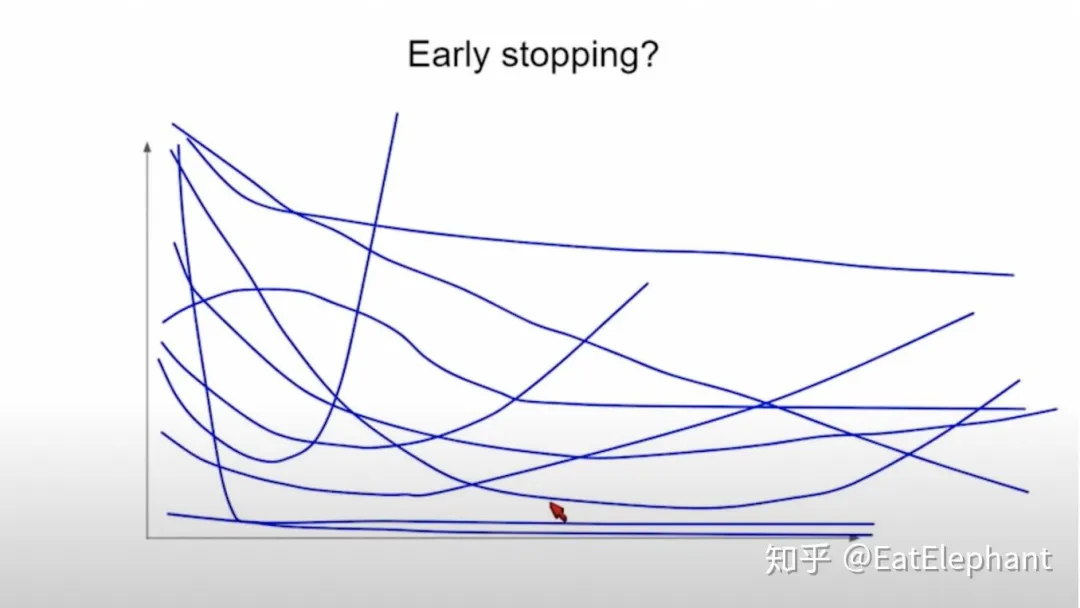
Regarding the common regular method, early stopping, due to different training curves for different tasks, it is necessary to adjust the weight of different tasks to make the curve trend consistent in order to determine a unified early stopping condition.
Multi-task Training Scheduler
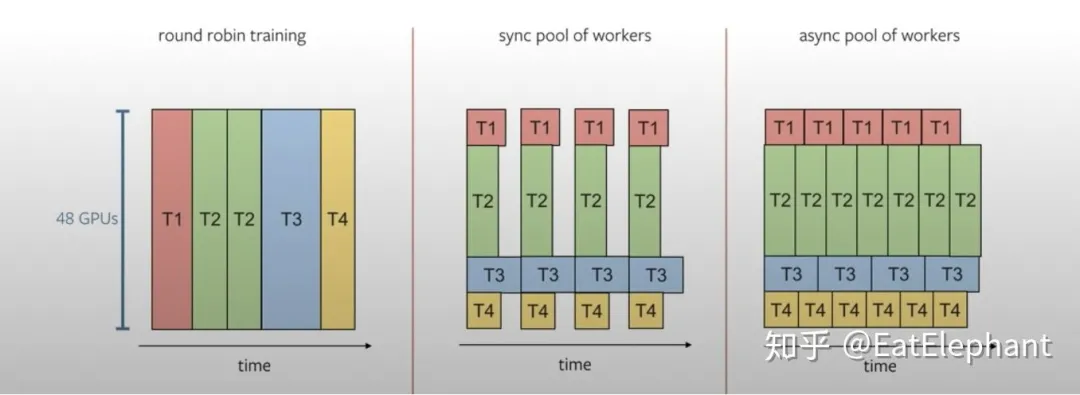
As shown in the following figure, Tesla utilizes distributed training machines for multi-task training to reduce training time. Karpathy mentioned that Tesla mostly uses the last two types of training task arrangements.
Workflow & Collaboration
Data Engine& Active Learning
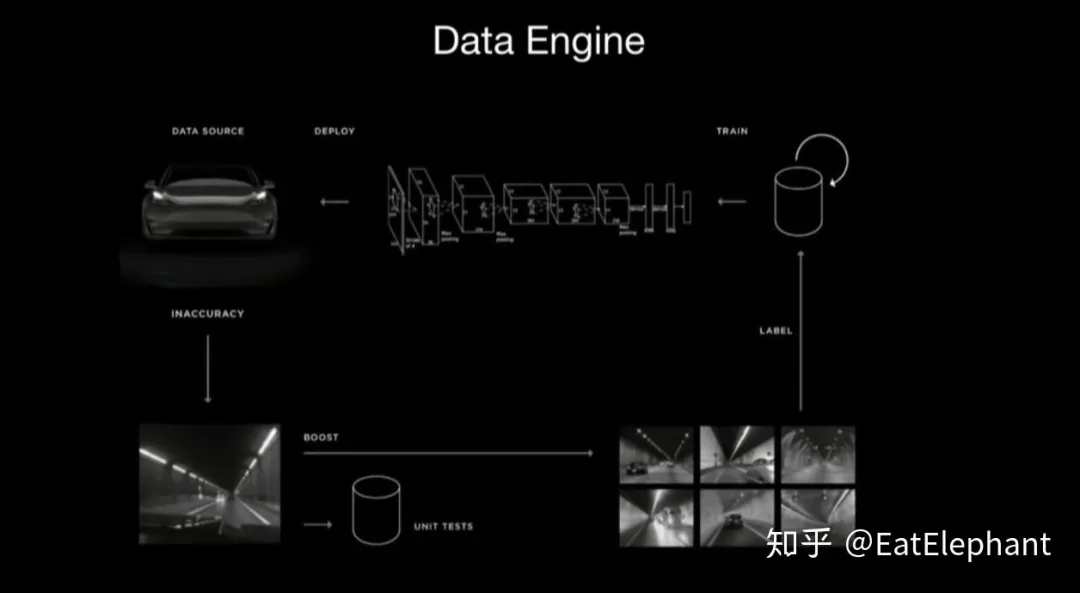
Tesla uses Shadow Mode to collect data and Trigger to trigger active data acquisition, thereby achieving Active Learning. The schematic diagram of Data Engine is shown below:
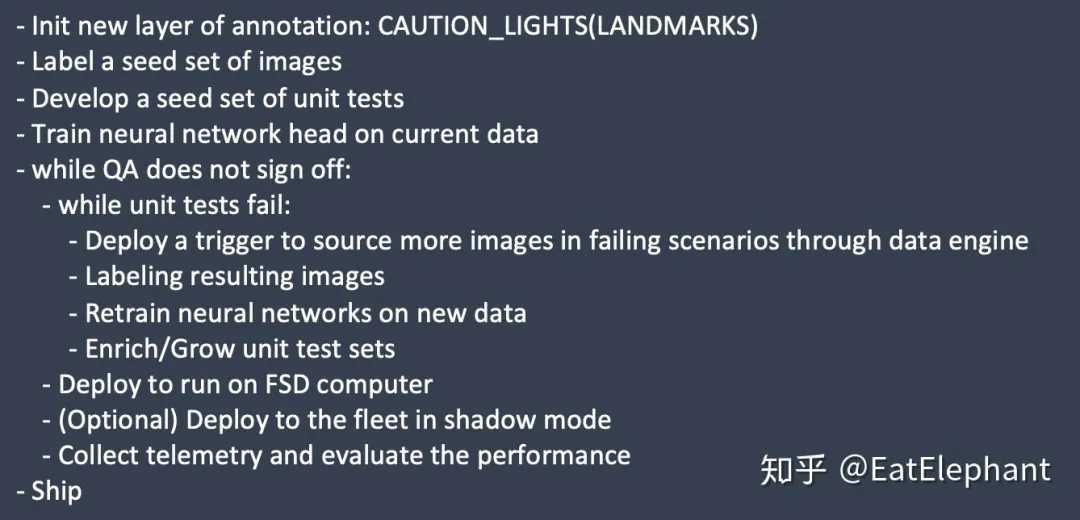
The process of using Data Engine to complete a new task is as follows:
 Translated English Markdown:
Trigger is a mechanism used to filter uploaded data by using a high recall, low precision rough classifier to identify specific training scenarios, which extracts rare cases and improves the data acquisition rate. At the same time, using different task triggers’ sampling rates can control the training resources occupied by different tasks, thus balancing the training effects of different tasks. The reason why trigger works is that it is essentially a simplified model, and the amount of data obtained by the data engine has been greatly reduced, so that manual screening can be used to remove false positive training data obtained by trigger.
By actively requesting data from over one million vehicles worldwide, Tesla was able to obtain a large amount of specific data needed to train the colossal HydraNet model.
Collaboration
Because the Tesla Autopilot Team is a small team, and the large and complex model’s functions often make each individual responsible for different tasks, a standard team collaboration process becomes crucial to tuning the model without causing it to deteriorate.
Karpathy’s report mentions several key collaboration experiences in multi-person AI projects, which are worthy of reference by industrial teams.
- Hyperparameters cannot be changed arbitrarily to improve the performance of one’s own work tasks.
Because Tesla FSD has to handle complex tasks and perform over 1000 perception tasks, even if the FSD uses a huge HydraNet model, the model’s expressive power is limited (Finite Model Capacity), and each team member should use the correct method to optimize their own tasks without damaging the existing model performance. For example, by increasing one’s subtask’s sampling rate in the Data Engine, or increasing the subtask’s weight in the overall loss, or even simply increasing the scale of one’s subtask’s loss function, training resources and model capacity can be skewed towards one’s own subtask to obtain false performance improvements. Such opportunistic behavior must be strictly prohibited.
- Finetune historical records should be avoided as much as possible.Translate the Chinese text in the following Markdown to English Markdown, while preserving the HTML tags inside the Markdown, and output only the result.
Through finetune, better model parameters can be obtained. However, unlike traditional software that has version control software like Git to record code changes, the finetune history of neural networks is often difficult to trace. If complex finetune histories are allowed to interweave, the problem that may arise is that while a very good model parameter may be obtained, it depends strongly on the complex finetune sequence used to obtain it. Because the finetune sequence cannot be traced, such a model parameter, even if its performance is excellent, has the disadvantage of being irreproducible. Therefore, in actual work, it is best to avoid complex finetune layering as much as possible.
Evaluation & Test
Karpathy refers to software that functions primarily via neural networks as Software2.0, which differs from traditional software that depends on logic, data structures, and algorithms. Software2.0 lacks industry consensus on Best Practice. Thus, Tesla borrows heavily from the Test-Driven Software (TDS) mindset used in traditional software during the development process.
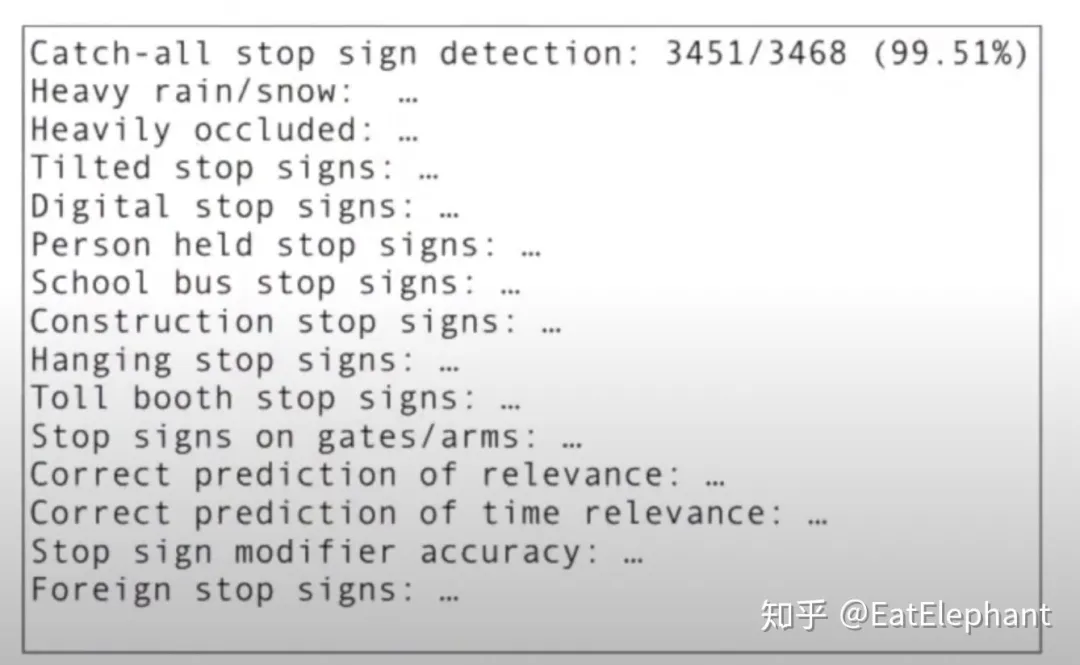
Tesla uses a powerful Data engine to obtain many corner cases to create Unit Tests/Regresion Tests of neural networks. For example, the figure below shows Tesla’s CT process for Stop Signs. All updates to the model must validate that the model’s performance has not regressed before a change can be submitted. The way to ensure that there is no regression is to pass all Unit tests.
This article is a translation by ChatGPT of a Chinese report from 42HOW. If you have any questions about it, please email bd@42how.com.
