When working on quarterly reports, it’s surprising to see where the 184,800 Tesla cars in a single quarter have gone.
With an increasing number of data sources, I want to analyze and summarize the delivery destinations and competition in each region. Firstly, let’s take a look at the data on SNE in Hana Financial Group’s report.
Overview of Regional Data
SNE’s data shows that the delivery volumes for the US, China, Europe and other regions were 61,600, 69,282, 31,205 and 22,790, respectively. However, the data does not match the US, China, and other regions’ revenues in Tesla’s financial report, which showed revenues of 4.424 billion, 3.043 billion, and 2.922 billion US dollars, respectively. Subtracting stationary energy storage revenue of 494 million US dollars, the prices of single vehicles in the United States, China, and Europe do not match. Therefore, it is estimated that Clean Technica’s data may be needed here (the US data is 75,300 units).
We can compare this with the data from 2020:
US: In 2020, Tesla sold 206,000 cars in the domestic US market, with a year-on-year growth of 14.9%. In fact, the demand for Model Y in the US is rising rapidly, so 75,300 is more reasonable.
European market: Sales in 2020 fell by 11.6% YoY to 98,000 vehicles, and Q1’s figure was 31,000. As European automakers push for BEV and PHEV sales in their domestic markets, Tesla’s competitive advantage in these markets is not clear.
Chinese market: In 2020, China was the main incremental market, with sales increasing by 203.0% YoY to 137,000 vehicles, and nearly 70,000 units in Q1. The market is expected to reach 300,000 units this year, but things are not so clear with the recent increase in negative news.
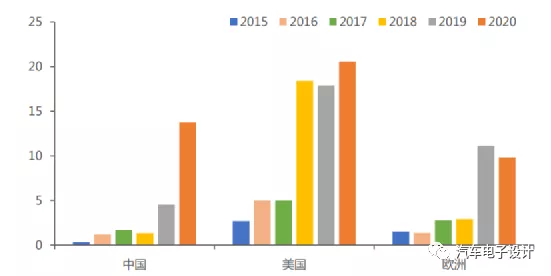
It is worth mentioning that Tesla is also expanding its presence in Asia, besides the Chinese market. In Q1, Tesla sold 3,149 units in South Korea and an estimated 800 units in Japan in March alone through its aggressive pricing strategy.
Situation in Europe
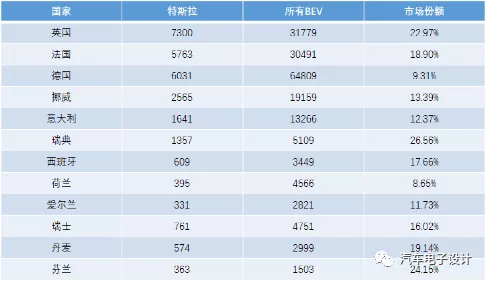
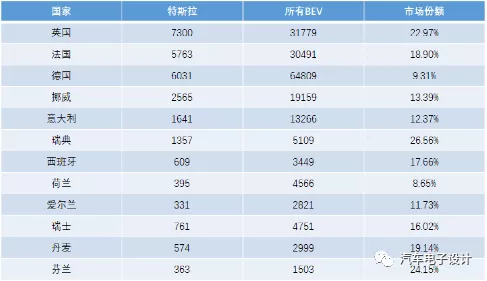
Tesla’s top three markets in Europe are the UK, France, and Germany, with Q1 sales at 7,300 (23.39%), 5,763 (18.47%), and 6,031 (19.32%), respectively.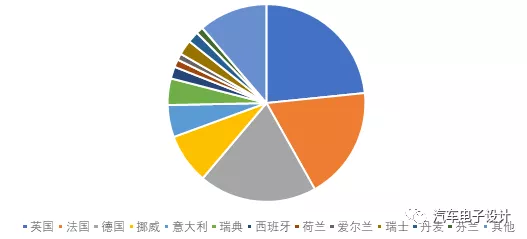
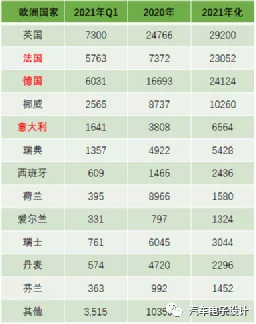
For the situation in Europe, I have extracted some data from major countries. Among them, Tesla’s annualized growth in France, Germany, Italy, and Spain is similar to doubling, and it is a small increase in Norway, the United Kingdom, and Sweden; of course, due to the lack of production capacity, it has a significant decline in Switzerland, Denmark, and the Netherlands.
Tesla’s remarkable aspect is that it has a 10% BEV market share in most countries (of course, this cannot be compared with the dominant 80% market share in the United States), but it still exceeds 25% market share in some countries. If Tesla wants to sell big in Europe, it still needs to open factories and make adjustments according to European demands.
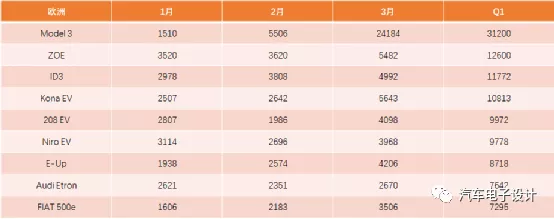
Of course, compared with European car manufacturers, the explosion of single cars is still evident. The Q1 figure of the second-ranked ZOE is close to 3 times. Although the investment in BEV in Europe has gradually increased, the differentiation of models is still relatively strong. Generally speaking, relying on PHEV data, the first-quarter figures of European car manufacturers look good, but compared with the competitiveness of BEV products alone, there is still a big gap. Under the subsidy, these cars can be sold without a problem, but whether they can truly stand firm depends on the long-term prospects.
Summary
When the model rankings of major countries are released, we can look at them one by one. I think that observing the small market differentiation in Europe (which is based on the preferences of car manufacturers in their countries) and analyzing the preferences of different regions in our country (due to local policy management and resources of major customers) have some similarities, which is quite interesting.
This article is a translation by ChatGPT of a Chinese report from 42HOW. If you have any questions about it, please email bd@42how.com.
