*Author: Yan-Zhi Auto
Definition of “Functional Safety” in ISO 26262: Absence of unreasonable risk due to hazards caused by malfunctioning behavior of E / E systems.
Essentially, the malfunctioning behavior of electronic/electrical systems can be caused by two types of failures:
- Random hardware failure: failure that occurs unexpectedly during the lifecycle of hardware elements and follows a probability distribution.
- Systematic failure: failure related to a certain cause in a determined way, and can only be eliminated by changing the design or production processes, operating procedures, documents, or other relevant factors.
From this perspective, the goal of functional safety is to control the random hardware failure and systematic failure of electronic/electrical systems within a reasonable (or acceptable) range. Proper and adequate safety analysis can help achieve this goal. Safety analysis methods include two types:
- Inductive analysis
- Deductive analysis
The ISO 26262 standard recommends FMEA (Failure Mode and Effects Analysis) and FTA (Fault Tree Analysis) for these two types of analysis methods, respectively.

On the other hand, ISO 26262 requires both qualitative and quantitative analysis for functional safety development. When trying to correspond these requirements with the analysis methods, there is a misunderstanding that FMEA can only be used for qualitative analysis and FTA can only be used for quantitative analysis, which is not true.
As two widely used analysis methods in many industries, FMEA and FTA can be used for both qualitative and quantitative analysis. Different industries will select and use them based on different goals.
In fact, both qualitative and quantitative analysis of FMEA and FTA play different roles in the process of functional safety development. This article will explain this point in detail.
Qualitative and Quantitative Analysis in FMEA
1.1 Introduction of FMEA# FMEA (Failure Mode and Effects Analysis)
FMEA has a long history, first proposed in the development of military equipment in the United States in 1949. Later, it formed an international standard introduced into the automotive industry in 1977. The current widely used standard in the automotive industry is the “Failure Mode and Effects Analysis – FMEA Handbook” jointly issued by the German Automotive Industry Association (VDA) and the Automotive Industry Action Group (AIAG) of the United States.
FMEA mainly addresses technical risks and is an analysis method for preventive quality management in product development and production processes. The biggest feature of the FMEA analysis method is to analyze the failure causes of each component in the system and their effects on the system, and then develop optimization measures for failure causes that may cause unacceptable impacts. It is a “bottom-up” analysis method.
1.2. FMEA and Qualitative Analysis – “Seven-Step Method”
In the 2019 version of the “Failure Mode and Effects Analysis – FMEA Handbook”, FMEA qualitative analysis is summarized as a seven-step method, as shown in the following figure.

Steps 1 and 7 were added in the new version, providing guidance for planning and final document work, while the five core steps in the middle are the essence of FMEA. The key points of these five steps are explained below.
1.2.1. Structural Analysis
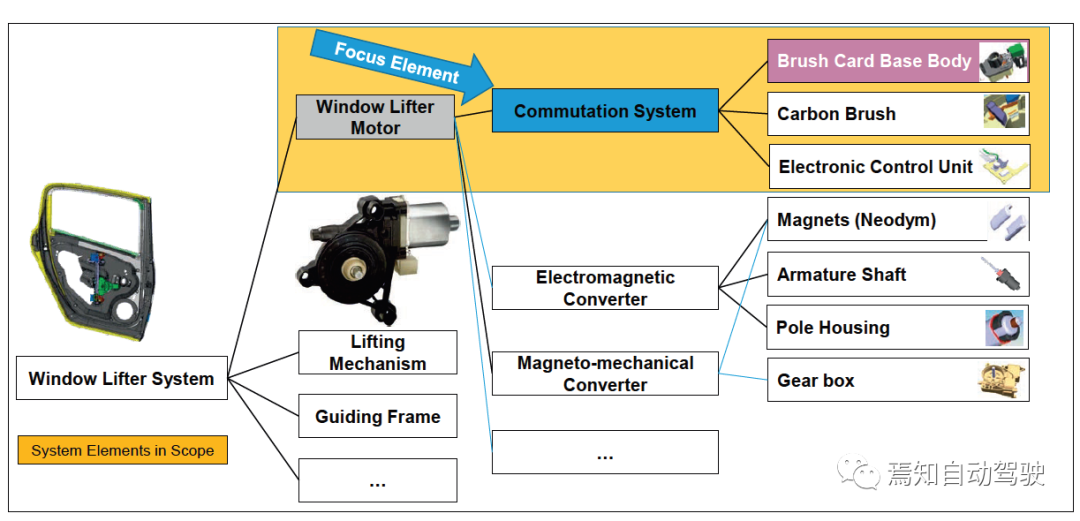
Here, structure refers to the structure of the system. The system is composed of several elements that have corresponding characteristics and are connected to other elements through certain relationships. At the same time, the system has a clear boundary that separates it from the external environment, and its relationship with the environment is defined by inputs and outputs.
The purpose of structural analysis is to describe the composition of the product clearly and completely, including the boundary of the system. In FMEA, the elements of the entire system are described in a tree-like diagram, as shown in the example of the car window lift system function network.
 1.2.2. Function Analysis
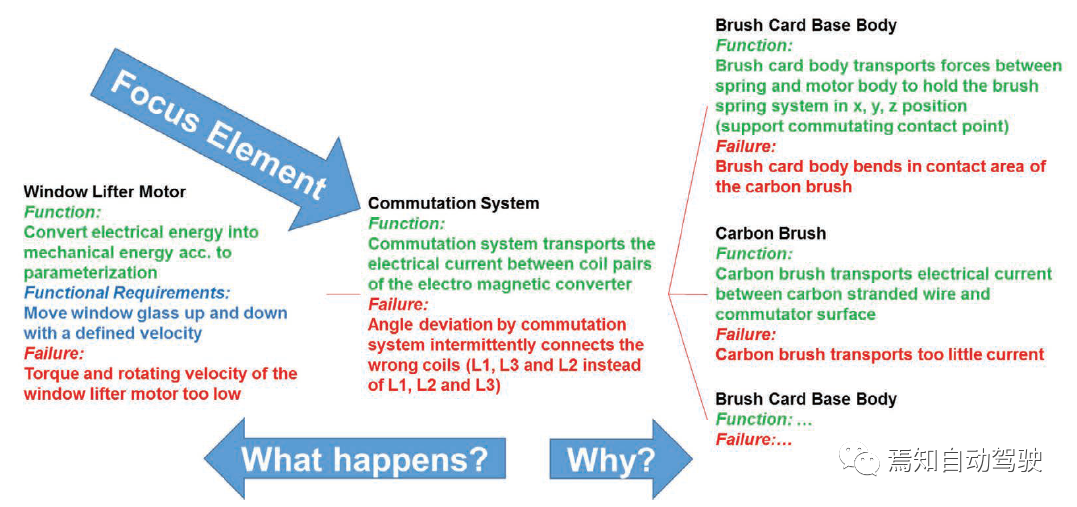
The purpose of function analysis is to ensure that product functions are appropriately allocated to the corresponding elements, thereby linking product functions and element functions to form a functional network. This work will be completed based on the established system structure tree.

1.2.3. Failure Analysis
The definition of failure originates from the definition of function. When a function cannot be realized, it is considered a failure. The failure modes of a function can be defined from the following perspectives:
-
Loss of function (e.g. inoperable, fails suddenly)
-
Degradation of function (e.g. performance loss over time)
-
Intermittent function (e.g. operation randomly starts/stops/starts)
-
Partial function (e.g. performance loss)
-
Unintended function (e.g. operation at the wrong time, unintended direction, unequal performance)
-
Exceeding function (e.g. operation above acceptable threshold)
-
Delayed function (e.g. operation after unintended time interval)
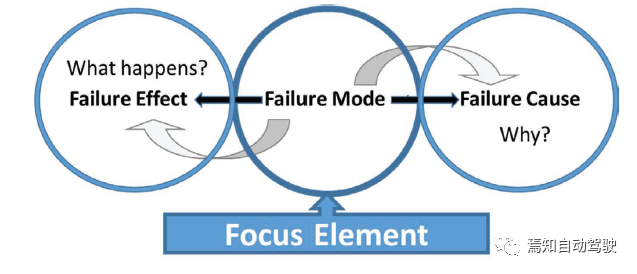
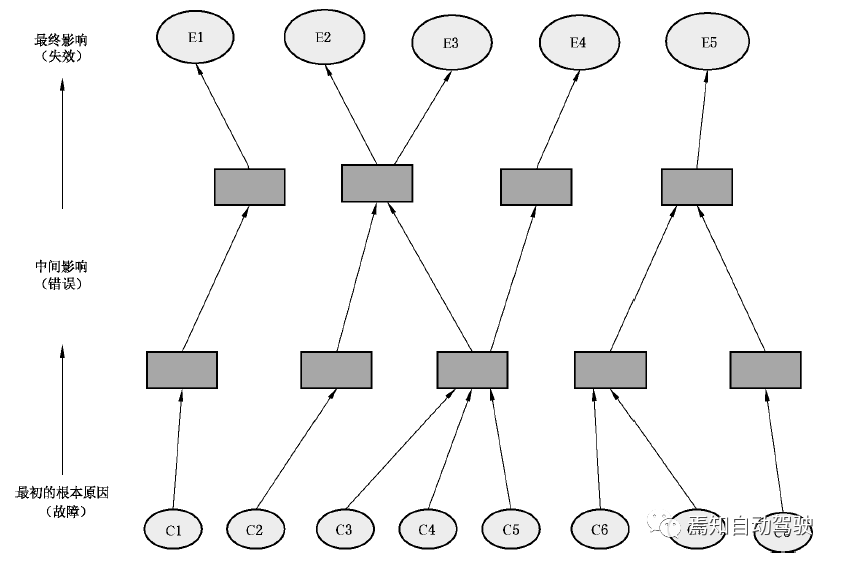
A complete failure network includes the following three elements, and their relationship is as follows. The purpose of failure analysis is to correctly identify the failure cause, failure mode, and failure effect, based on the functional network.
-
Failure cause
-
Failure mode
-
Failure effect

Failure mode is the way in which an element fails to meet the expected function, while failure cause is the reason that leads to the occurrence of failure mode, and failure effect is defined as the consequence caused by failure mode.
1.2.4. Risk Analysis
The purpose of risk analysis is to determine the priority of optimization measures by evaluating the severity, occurrence and detection of risks.
-
Severity value refers to the severity of the top-level (vehicle-level) failure effect. In simple terms, 10 means the most severe and 0 means the least severe.
-
Occurrence value reflects the possibility of failure cause occurring under the preventive measures taken to avoid failure cause. In simple terms, 10 means the highest possibility and 0 means the lowest possibility.
-
Detection value reflects the effectiveness of detecting failure cause before the product is put into mass production. In simple terms, 10 means the worst effectiveness and 0 means the best effectiveness.
1.2.5. Optimization
After determining the S, O, and D values of the failure net, risk analysis will be conducted to determine the priority of optimization measures. Each company may have its own standards for risk assessment. Some companies use RPN value, RPN = O * D * S, to determine the priority based on the size of RPN results. Some companies use the result of S * O value. Regardless of which evaluation standard is adopted, the core objective is to identify the most critical point in the system that needs to be optimized.
The purpose of optimization is to define new preventive and detection measures for failure causes that need further measures to reduce the O/D value and reduce the risk to an acceptable level.
1.3. FMEA and Quantitative Analysis – FMEDAIn functional safety development, FMEDA (Failure Modes, Effects and Diagnostic Coverage Analysis) is widely known as a method for analyzing random hardware failures of electronic components. In fact, FMEDA is developed based on the “bottom-up” analysis approach of FMEA, with the addition of the following two parts:
-
The failure rate and failure mode distribution of each failure mode of the underlying faults
-
The diagnosis and diagnostic coverage of failure modes
From this perspective, FMEDA can be considered as a typical application of the quantitative analysis of FMEA.
The first step of FMEDA is to identify the impact of each failure mode of electronic components on the system. To achieve this goal, the “structure analysis”, “function analysis”, and “failure analysis” steps in the qualitative analysis of FMEA, mentioned in the previous section, need to be used to construct the functional and failure networks. Once the failure network is determined, the electronic components and their failure modes with safety impacts are also determined.
The second step of FMEDA is to determine the following three values for each safety-related failure mode, in order to provide data support for quantitative analysis (as further explained in section 2.3.3 “Collaboration of FTA and FMEDA”):

For example, let’s assume that the failure mode and failure rate information of resistor R72, determined by standards and relevant manuals, is as follows:

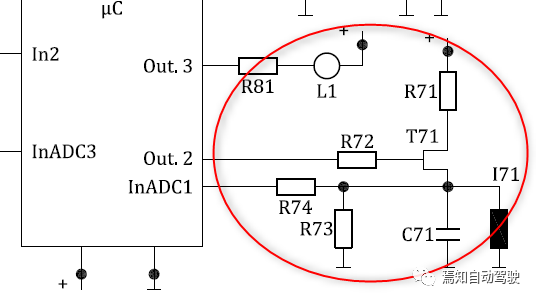
To facilitate further analysis in the following sections, the following conventions are made:
λ _SPF: Single point of failure failure rate
λ _RF: Residual failure failure rate
λ MPFL: Latent failure failure rate
λ _sum: Total failure rate of electronic components
λ _unsafe: Total safety-related failure rate of electronic components
λ _type: Total failure rate of a certain failure mode of electronic components
Assuming that a short circuit of R72 directly violates safety requirements, but does not constitute a monitored mechanism for short circuit faults in multi-point failure circuits with a coverage rate of 90%, the analysis result of this failure mode is:“`
λ _SPF = 0 (FIT)
λ _RF = λ _type * (1-90%) = 28 * 10% = 2.8 (FIT)
λ PMFL = 0 (FIT)

Assuming that the R72 circuit breaker will not directly violate safety requirements, but it will form a dual-point failure with the failure of another component. There is a monitoring mechanism for circuit breaker faults in the circuit, and the coverage rate is 80%. The analysis results of this failure mode are as follows:
λ _SPF = 0 (FIT)
λ _RF = 0 (FIT)
λ PMFL = λ _type * (1-80%) = 8 * 20% = 1.6 (FIT)

In summary, the analysis of R72 by FMEDA is as follows:

Qualitative and Quantitative Analysis in FTA
2.1. Introduction to FTA
Before 1961, methods for safety and failure analysis were limited to qualitative analysis of failure modes and their impact on system components. However, as the complexity of systems gradually increased, it became increasingly difficult to clarify the impact of each failure mode on the system; at the same time, this analysis method was not suitable for quantitative analysis of system reliability.
In 1961, based on the theory of reliability, H. Watson, a Boolean algebra engineer at Bell Labs, introduced a Boolean model with logical symbols into the failure analysis method to quantitatively evaluate the reliability of control systems, and FTA was born.
After Boeing Company first publicly used FTA in the Minuteman I launch control safety research and obtained good practical results, FTA was subsequently introduced into the aerospace, nuclear engineering, and robotics industries. Decades of development have made FTA widely used in evaluating the safety and reliability of complex systems.
In 2011, ISO 26262 introduced FTA as a recommended deductive analysis method in the development of automotive functional safety.What is Fault Tree Analysis (FTA)? Simply put, FTA is a “top-down” analysis method that starts from the effects to find the causes. The top-level effect is usually called the top event, and the bottom-level cause is called the primary event.
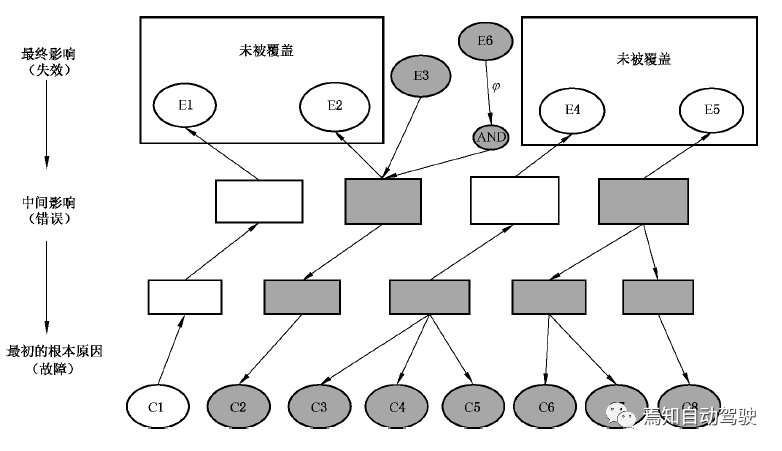
The functions of FTA can be summarized as follows:
1) Identify the primary events and combinations that may cause the top event to occur unexpectedly.
2) Screen out the primary events or combinations that are most likely to cause the top event to occur unexpectedly.
3) Calculate the probability of the top event occurring unexpectedly using Boolean algebra theory.
4) Determine the ideas and directions for improving the design.
2.2 FTA and Qualitative Analysis – Cut Set
The main function of FTA’s qualitative analysis is to identify the relationship between the top event and the primary event by constructing a fault tree, as well as identifying the primary events and combinations that may cause the top event to occur unexpectedly.
Because FMEA is triggered from the bottom-level reasons of the system, when analyzing a failure mode of a bottom-level event, it assumes that all other bottom-level events are in normal operating condition and does not consider the impact of system-level failures caused by simultaneous failures of multiple bottom-level events. Therefore, FMEA is only used to analyze single point failures.
The advantage of FTA is that it can analyze multiple point failures. The following example of the EPB system (Electric Parking Brake) will illustrate the advantage of FTA’s qualitative analysis.
Constructing a fault tree is the first step in conducting FTA’s qualitative analysis, and determining the top event is the first step in constructing a fault tree. In functional safety analysis, the system’s Safety Goal is usually defined as the top event. Taking a Safety Goal of the EPB system as an example, let’s construct a fault tree and explain how FTA does qualitative analysis.
Safety Goal: EPB should avoid erroneous build-up of pressure, which results in excessive deceleration, ASIL: C
This Safety Goal corresponds to the dynamic hydraulic braking function of the EPB system. Regulations require that the EPB system be able to serve as a second set of vehicle braking systems. By pulling up the EPB switch, the electronic hydraulic braking unit can actively build pressure to achieve a minimum deceleration of 1.5 m/s2.
The dynamic hydraulic braking function is implemented by the ESC Assy’s SSM module, which mainly functions as follows:
-
Evaluation of the state of the vehicle (static/dynamic)- Respond to the driver’s intention to release and apply the parking brake.
-
Comfort functions are available, such as automatic release and application.
-
Request the dynamic deceleration function.
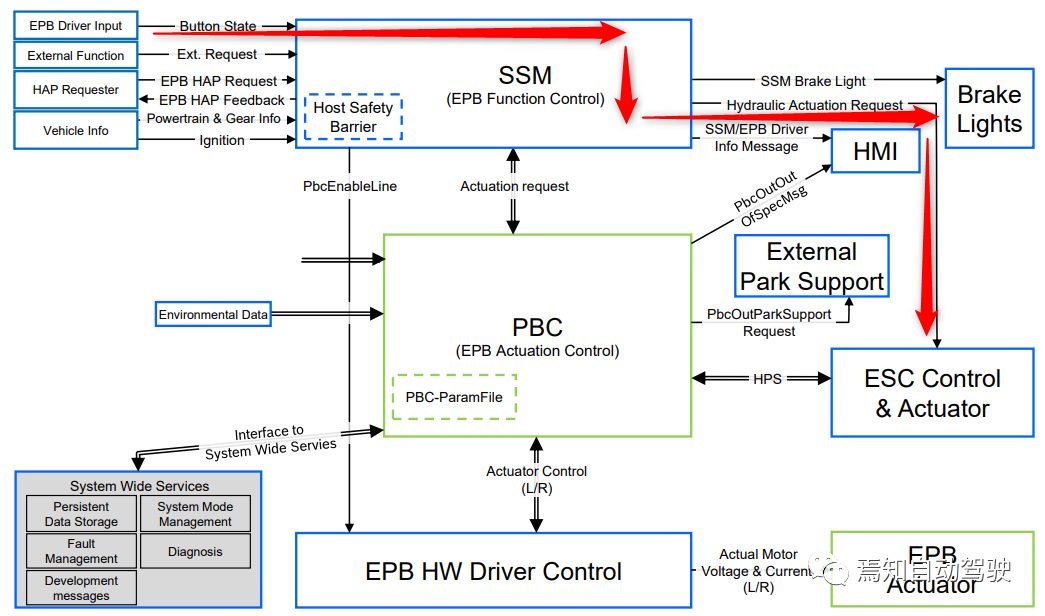
When the dynamic hydraulic function is working correctly, its signal chain is as follows: EPB switch is pulled up → SSM module calculates target deceleration → ESC responds by building pressure corresponding to the target deceleration. Conversely, any of the following events will cause the top event to occur (OR gate):
-
The EPB switch is pulled up without error.
-
The SSM module requests dynamic pressure build-up in error.
-
ESC erroneously builds up pressure proactively.
Finally, the constructed fault tree is displayed as follows (the fault tree shown here is for example purposes only and omits many details that exist in actual development):
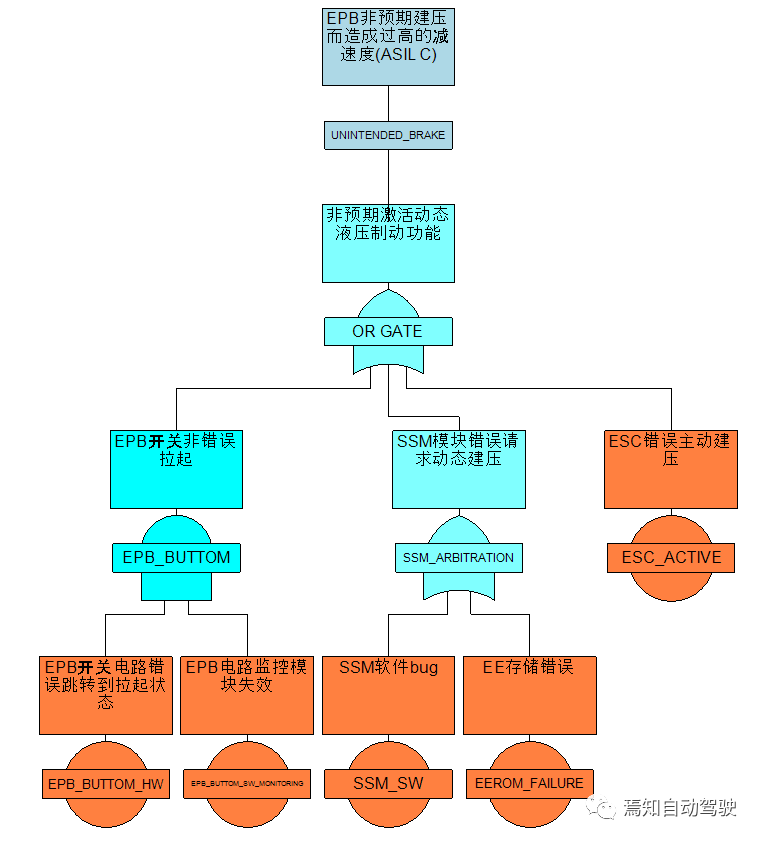
Based on the relationship between top events and bottom events, the original events and combinations of original events that may cause the top event to occur unexpectedly are identified, i.e., cut sets.
When an original event can cause the top event to occur unexpectedly, it is marked as order = 1; when two original events need to occur simultaneously to cause the top event to occur unexpectedly, it is marked as order = 2, and so on.
The cut set result confirms the advantage of FTA qualitative analysis over FMEA, as it can identify both single-point and multi-point failures that affect safety goals. Based on the analysis results, faults that affect safety goals and the type of faults (single-point or multi-point) can be screened out to optimize the design.

2.3. FTA and Quantitative Analysis – SPFM, LFM, PMHF
In functional safety development, FTA quantitative analysis is widely used to calculate whether the random hardware failure rate of electronic and electrical systems meets the following two requirements:1. Evaluation of the hardware architectural metrics
- Evaluation of safety goal violations due to random hardware failures
2.3.1. Requirement 1: Evaluation of the Hardware Architectural Metrics
In short, hardware architectural metrics are used to evaluate the effectiveness of the architecture in responding to random hardware failures for relevant items. These metrics only target certain safety-related electronic and electrical hardware components in the relevant items, which can have significant impacts on the violation or achievement of safety goals, and are limited to the single-point, residual, and latent failures of these components.
The evaluation of the hardware architectural metrics aims to achieve the following objectives:
-
Show whether the coverage of safety mechanisms for mitigating the risks of single-point or residual failures in the hardware architecture is sufficient (single-point fault metric, SPFM);
-
Show whether the coverage of safety mechanisms for mitigating the risks of latent failures in the hardware architecture is sufficient (latent fault metric, LFM).
The calculation formula for the single-point fault metric is:

where the denominator is the sum of the failure rates related to safety.
ISO 26262 requires the single-point fault metric as follows: there are no requirements for safety goals of ASIL A, no mandatory requirements for safety goals of ASIL B, and mandatory requirements for safety goals of ASIL C and ASIL D.
The calculation formula for the latent fault metric is:

where the denominator is the sum of the failure rates related to safety.
ISO 26262 requires the latent fault metric as follows: there are no requirements for safety goals of ASIL A, no mandatory requirements for safety goals of ASIL B, and mandatory requirements for safety goals of ASIL C and ASIL D.## 2.3.2. Requirement 2: Evaluation of Random Hardware Failures Leading to Violation of Safety Objectives
In simple terms, the evaluation of random hardware failures leading to violation of safety objectives is used to determine if the residual risk of violating safety objectives is low enough.
The most commonly used method is the “Probabilistic Metric for random Hardware Failures (PMHF)”, which represents the average failure probability per hour during the operational period of the car. The requirements of ISO 26262 for PMHF are as follows:

2.3.3. Cooperation between FTA and FMEDA
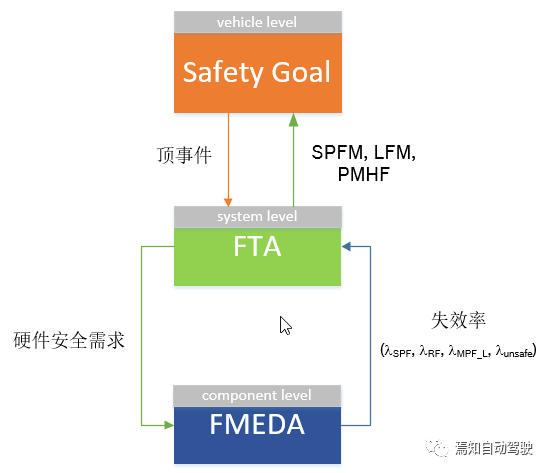
The goal of quantitative analysis in Fault Tree Analysis (FTA) is to calculate and analyze whether the random hardware failures of electronic and electrical systems meet the requirements of SPFM, LFM, and PMHF in ISO 26262. This process requires cooperation between FTA and Failure Modes, Effects, and Diagnostic Analysis (FMEDA).
From a microscopic perspective, for the ECU circuit diagram of an electronic and electrical system, we can determine the failure modes, corresponding failure rates, and diagnostic coverage for all electronic components in the diagram. However, from a macroscopic perspective, two points need to be clarified:
-
Not all electronic components can cause safety issues for the entire vehicle.
-
For a safety-related electronic component, not all failure modes can cause safety issues for the entire vehicle.
Therefore, it is necessary to analyze and screen the failure modes of all electronic components.
In the qualitative analysis process of FTA, the bottom events identified in the fault tree have already identified hardware failures that can cause safety impacts on the entire vehicle. These bottom events are converted into system demands for hardware, which are input to FMEDA to construct a failure network of top-level failures and bottom-level electronic component failures. After confirming the failure network, FMEDA analyzes and determines the failure rate and proportion of fault modes of electronic components related to safety, as well as the diagnostic coverage of safety mechanisms, and provides relevant data as input to FTA.
It should be noted that in addition to designing safety mechanisms at the ECU level, safety mechanisms that meet a certain diagnostic coverage rate can also be designed at the software level (i.e., software monitoring), which is not included in FMEDA but exists in the FTA fault tree.
Therefore, when calculating SPFM, LFM, and PMHF in FTA, the input is not only from FMEDA but also from the software layer’s safety mechanism coverage rate added to FMEDA.
 ### Summary
The following points can be summarized from the above explanation:
-
FMEA and FTA are two different analysis methods introduced into functional safety development. Both can perform qualitative and quantitative analyses.
-
The main objective of FMEA’s qualitative analysis is to identify the causes of failures of each component of the system and their impact on the system. Based on this, optimization measures can be taken for the causes of failures that result in unacceptable effects.
-
FMEDA is a method of random hardware failure analysis for electronic components which is essentially developed based on the methodology of FMEA. Therefore, it can be considered that FMEA’s quantitative analysis is reflected in the application of FMEDA.
-
The main purpose of FTA’s qualitative analysis is to identify the relationship between top events and bottom events by constructing a fault tree. Meanwhile, the original events and their combinations that may cause the top events to occur unexpectedly can also be recognized.
-
To determine whether the random hardware failures of electronic systems meet the quantitative requirements of ISO 26262, FTA and FMEDA are usually used together. FTA provides FMEDA with design requirements from its bottom events, while FMEDA provides data related to random hardware failures for FTA.
This article is a translation by ChatGPT of a Chinese report from 42HOW. If you have any questions about it, please email bd@42how.com.
