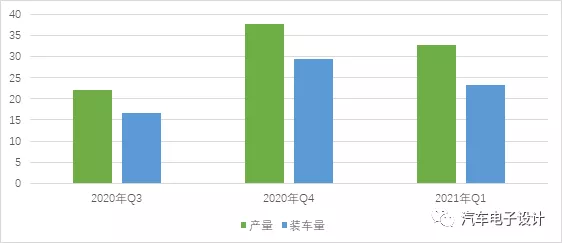
At the end of a quarter, it is necessary to make a detailed comparison of the actual situation of the first quarter’s power batteries. First of all, let’s quote the data released by the China Automotive Power Battery Industry Innovation Alliance. The March production, sales and installation volume were 11.3 G, 8.9 G and 9.0 G respectively, and the cumulative Q1 production, sales and installation volume were 32.8G, 23.9G and 23.2 G respectively. Based on this data, we will gradually explore the following topics.
Production and Installation Volume
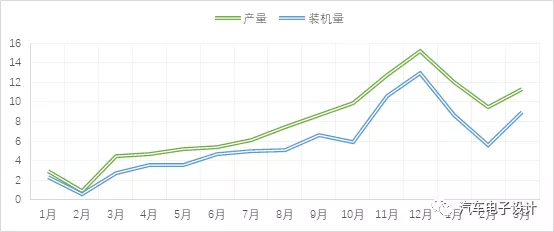
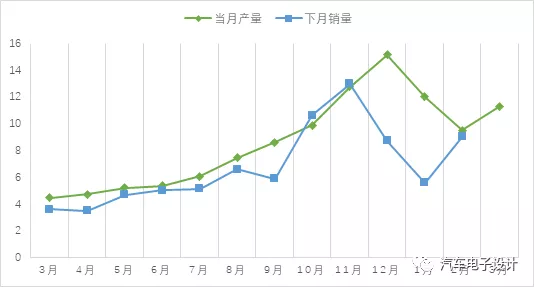
As shown in Figure 1 above, the production and installation volume of power batteries have been more than 5 GWh lower than expected for each quarter, and a cumulative total of 23.4 GWh in the past three quarters. In fact, if we extend the cycle to February of last year, this difference has been stable at 2-8 GWh. There are several possible explanations: battery production cycle, battery shortage inventory (the occupation of warehouses for battery modules and systems is large, and it is difficult to say whether this is for preparation of the next quarter’s rush).
Of course, it is also possible that some of the batteries have been used for maintenance or replacement. Overall, this foreword may reflect that the demand for Q2 and Q3 will continue to rise. However, there are several assumptions here:
A) The production of Q1 power batteries is at a high level, and the Q1 installation has not caught up. Currently, the price of chips and other materials has increased, making it more difficult to increase battery production later.
B) If the subsequent production plans of automakers go well, then Q2’s electric vehicles should be calculated based on the installation volume of Q1, and the potential corresponding gap of 23.4 GWh will make the electric vehicles in Q2 take another step forward.
Quarterly Comparison of Lithium Iron and Ternary
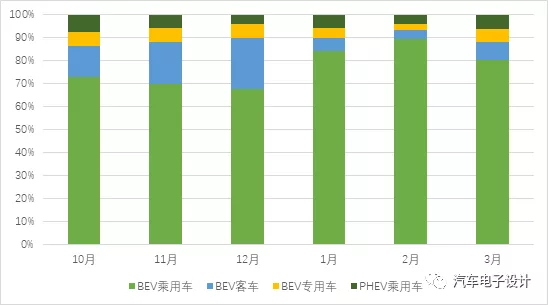
Production: In March, the production of ternary batteries was 5.8 GWh, accounting for 51.6% of total production, an increase of 79.6% year-on-year and 13.7% month-on-month; the production of lithium iron phosphate batteries was 5.4 GWh, accounting for 48.3% of total production. The cumulative production of ternary batteries from January to March was 17.8 GWh (54.3%).Sales Volume: In March, a total of 5.1 GWh of ternary batteries and 3.9 GWh of lithium iron phosphate batteries were shipped. From January to March, cumulatively, ternary batteries reached 13.8 GWh (equivalent to 59.5% share) and lithium iron phosphate batteries reached 9.4 GWh (equivalent to 40.4% share).
Currently, the gap between lithium iron phosphate and ternary batteries is narrowing, especially in passenger cars, where more and more models are equipped with lithium iron phosphate batteries. After the breakthrough of the bottleneck of the energy density of 190Wh/kg, we have seen that the change of lithium iron phosphate mainly occurs in the fast penetration of passenger cars. The difference between ternary batteries and lithium iron phosphate in Q1 is mainly due to the reduced demand for buses in the first quarter.
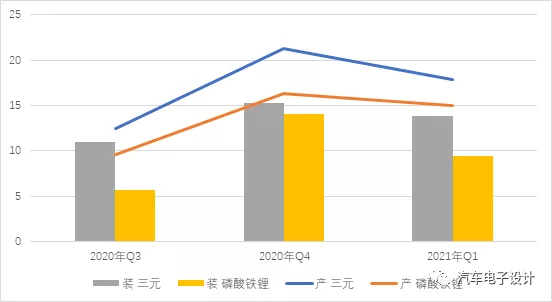
In this quarter, the proportion of buses in the overall percentage has been compressed to 5%-8%, so the overall demand for LFP will be reduced. With the rise in demand for LFP in passenger cars, the overall percentage of LFP can quickly surpass ternary batteries.
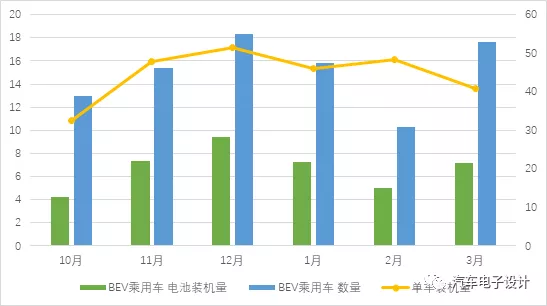
Average installed capacity of passenger cars
The problem of average installed capacity is quite serious. With the increase of A00, the per-vehicle installed capacity of pure electric passenger cars BEV in March has been successfully reduced to 40 kWh, which is 11 kWh less than the peak value in December. The data for December was 9.42 GWh for 183,000 BEVs, and in March, it was 7.17 GWh for 176,000 BEVs, with a difference of about 2.3 GWh.
If we calculate based on the previous algorithm, among 2 million passenger cars, PHEV accounts for 15%, which is 300,000, and 1.7 million are pure electric. If calculated based on the installation of 40 kWh, the overall demand scale is only 70 GWh. As a reference, last year, 991,000 BEVs corresponded to 43 GWh. Because the expected increase in PHEV and other segment areas is not significant in the short term, using this calculation, the additional 27 GWh is indeed not much.
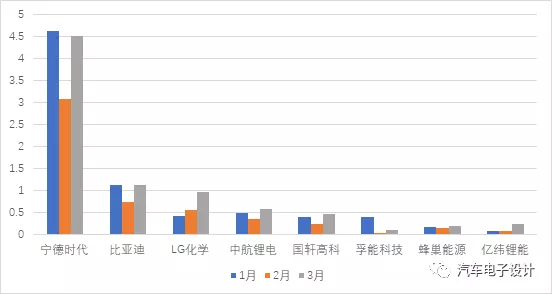
Supplier situationNow the supply of power batteries is evolving one-sidedly, with huge differences between the ability to keep up with and the inability of the second-line capacity to keep up, due to differences in production expansion rates. The differentiation of electric vehicles at the top and bottom requires a must-have strategy: either choose a low-cost continued strategy or try to tap into overseas markets.
Summary
As the problem of negative fuel consumption credits becomes more prominent, A00 has strategic value in offsetting this aspect. On the one hand, it provides a faster incremental aspect to the overall new energy vehicle sector, but of course, the pull on battery demand is not significant. The practice of replacing this round of ternary materials with LFP and then reducing prices to expand their application range is also evident.
This article is a translation by ChatGPT of a Chinese report from 42HOW. If you have any questions about it, please email bd@42how.com.
