Electric Car Testing is a Bit Boring
Apart from the occasional acceleration of Tesla and the media-driven off-road trip of Jaguar, most of the content is about charging, range, and energy consumption.
The original wild beauty of cars is relatively bland.
Don’t get me wrong, I have no intentions of showcasing the wildness of electric cars in today’s content. Rather, I want to give a warning in advance that today’s content is probably going to be very tedious, based on rigorous boredom.
Electric car owners often talk about the range of their cars. When everyone agrees, they feel like they have discovered the truth of the world. Unfortunately, when opinions differ, they can only suspect that the other driver’s habits may have deviated.
When you really want to compare the performance of different cars, you accidentally find yourself talking about the performance parameters of the car when it left the factory. This is because these parameters represent the performance under the same set of standards. By comparison, personal tests are not authoritative.
Standards are used to establish consensus. However, we occasionally doubt the credibility of standards.
Is the standard really worth promoting?
That’s what we’re going to talk about today.
How Are Standards Established?
The earliest standards date back to the 1970s.
As shown below, the United States has its own standards, Europe has its own standards, Japan has its own standards, but what about China? China did not have its own standards at that time.

Why establish this set of testing standards?
If you break down the acronym EPA, it stands for Environmental Protection Agency. The purpose of the test initiated by the Environmental Protection Agency is clear. It was originally to test fuel consumption and emissions.
Environmental protection is an issue that brings together the ideals of idealists who care about the future of humanity with the non-existent commercial ethics of companies’ cheating behavior.
Most people don’t care about emissions, they only care about fuel consumption. Car enthusiasts who love fuel vehicles don’t care about efficiency like electric car owners do, although the differences in efficiency will truly affect the development and transformation of fuel vehicles, hybrid cars, and electric cars.
Returning to the standard itself, before establishing consensus, what needs to be done is to explore the common driving habits of local car owners and establish an effective testing standard.
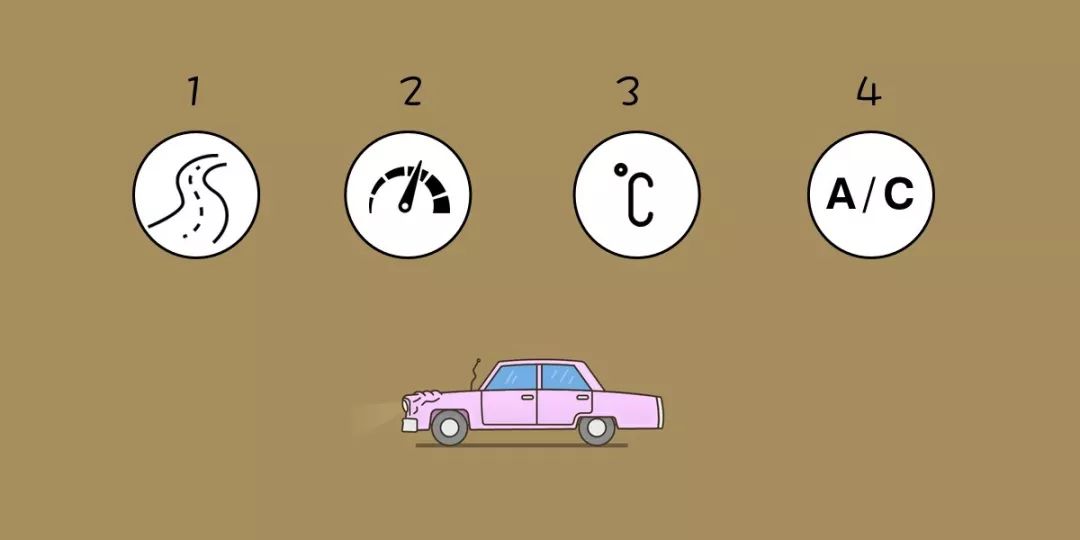 The difference between standards lies in how to set the maximum driving speed, average driving speed, acceleration time, driving distance, temperature, and air conditioning usage, etc. A complete set of settings is what we often call a “driving cycle.”
The driving cycle is based on multiple scenarios, including urban scenarios, suburban scenarios, high-speed scenarios, etc. Each driving cycle includes multiple loops, and each loop is a complete process that starts from the vehicle’s launch and ends with a stop, aimed at a single scenario.
The comprehensive driving cycle refers to the weighted sum of each individual loop.
Due to the different traffic situations in each country, such as the different maximum speed standards set by each country and the congestion caused by population density, it is difficult to unify standards for the maximum driving speed and average driving speed.
Let’s take another look at the chart from earlier.

From the 1970s to now, there are several mainstream driving cycles, including the US EPA, the European NEDC, and the WLTP under the WLTC standard, and Japan’s JC08. Before officially launching its own driving cycle, China has been using the European NEDC.
The NEDC range, which is the continuance test of MIIT’s driving cycle, is the most familiar to us, followed by the EPA range in the United States. In Tesla’s vehicle settings, typical range corresponds to EPA range, and rated range corresponds to NEDC range.
In actual driving, we find that the EPA range is closer to the actual achievement.
Now, let’s reveal why this is the case.
Is MIIT range not realistic enough?
First, let’s take a look at two seemingly dull charts.
The first one is from NEDC.
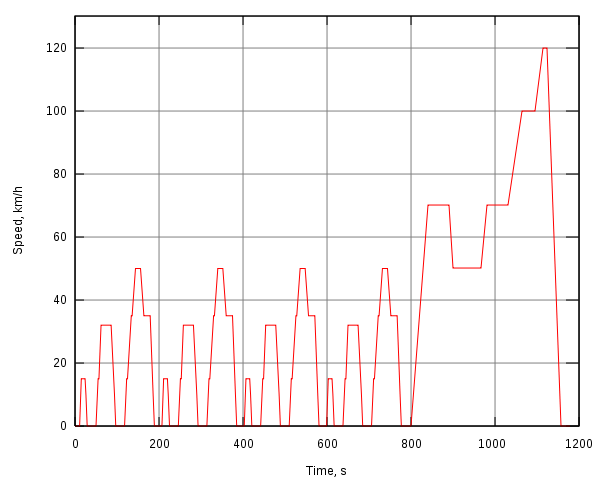
The left side from 0 to 780 seconds is a loop called “urban cycle” (ECE-15), where the maximum driving speed does not exceed 50 km/h, and the average speed is 18.35 km/h. When we talk about the range of a driving cycle in an urban scenario, we are generally referring to this loop.
At the same time, you can also see from the chart that the curve’s direction is identical every 195 seconds. That is, the same driving situation was repeated four times in the urban cycle.From 780 seconds to 1180 seconds is the second cycle, which we call suburban cycle, with a maximum speed of 120 km/h and an average speed of 62 km/h.
Have you noticed anything unusual?
If not, take a look at the EPA chart.
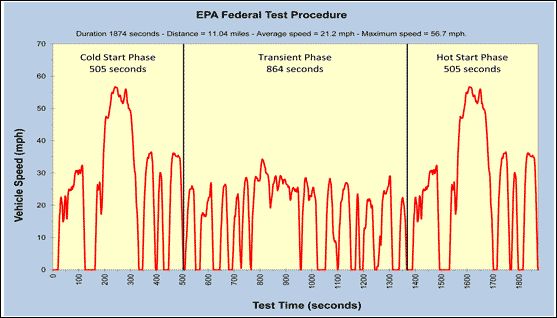
The EPA curve changes non-uniformly, while the NEDC curve changes uniformly.
The EPA curve is closer to the actual driving speed fluctuations, while the NEDC is too idealistic and does not even consider the use of air conditioning.
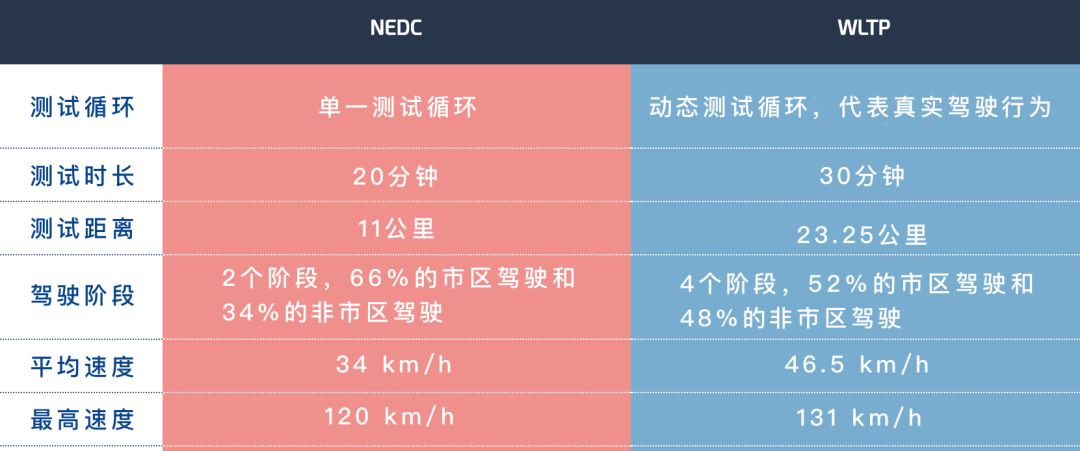
So, starting in 2015, Europe began researching new test standards, namely WLTP, and the working conditions under the WLTP standard are referred to as WLTC.
The following chart, using an example from the WLTC cycle, shows that WLTC curves are becoming more like EPA curves, no longer appearing in uniform acceleration and deceleration conditions, and are closer to actual driving conditions.

Unfortunately, new energy vehicles in China have not yet considered applying the WLTC.
After China VI, fuel consumption will continue to use NEDC, while emission standards will introduce WLTC to approach more realistic driving conditions.
So how does EPA test emissions?
Initially, EPA only had two conditions, one was a city cycle and the other was a highway cycle. Later, starting in 2008, additional conditions were added.
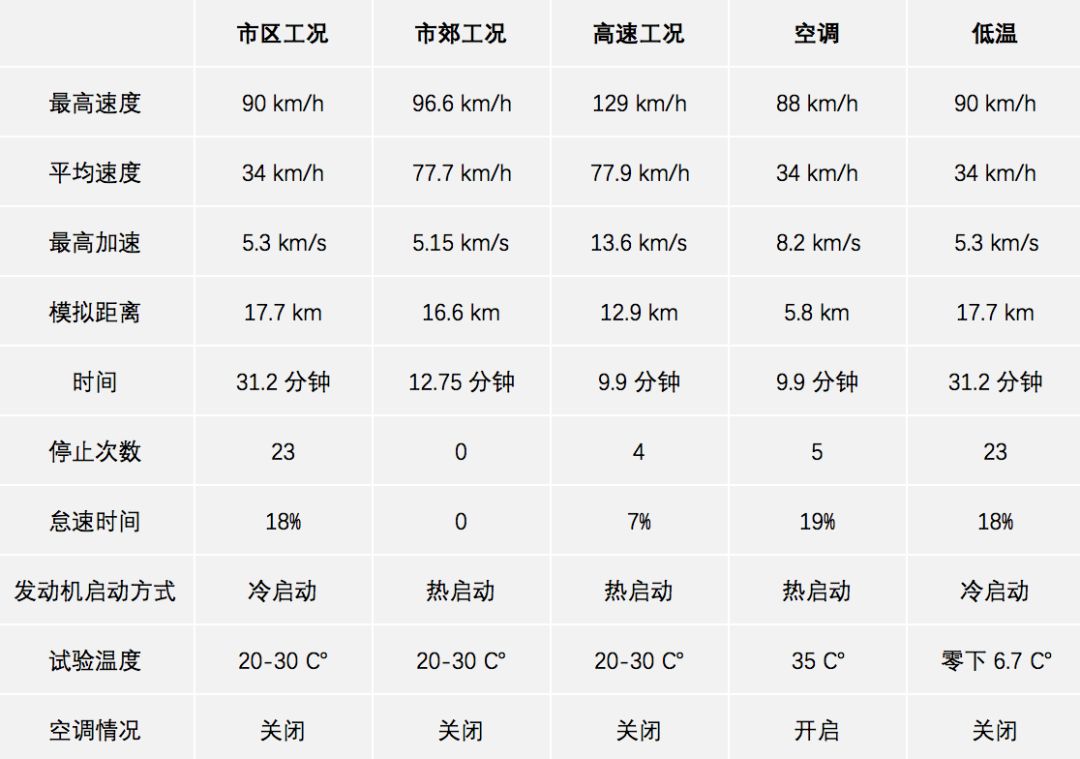
As you can see, the high-speed cycle added by EPA began to consider the situation of high-speed driving, while air conditioning and low temperatures are supplements to city cycle conditions.After more than 40 years of standard implementation, vehicle performance has been continuously updated and iterated, and the earliest operating conditions no longer fully represent actual driving behavior. This is also the source of the deviation between the range results of the working conditions and the actual ones.
Another reason is that in the process of formulating working condition standards, the research methods for driving behavior have also become outdated.
Traditional working conditions are actually analyzed based on research and data from a limited sample, and thus have deviations from the real situation. For example, research projects on Chinese working conditions that began in 2015 have already started collecting driving data from some Internet platforms.

Note: There are currently two Chinese working conditions, CLTC and CATC. According to industry insiders, the accurate one should be the former.
In the future era of intelligence, manufacturers can easily obtain the actual driving data of each car owner, and extract common driving behaviors from such big data to formulate working conditions, which should be much more accurate than now.
However, under the premise that we are still using the NEDC cycle, please remember that the cruising range score will be higher than the actual cruising range score.
ps. In the previous ranking of pure electric vehicles with a range of 100 kilometers, two small errors were corrected: one was that Model S 85 was written as X, and the other was that EPA’s high-speed operating conditions were actually the third type of aggressive driving conditions in the previous figure, and the high-speed operating conditions in the original picture should be suburban operating conditions.


 * Why do Tesla batteries have a short cycle life but run for a long time?

This article is a translation by ChatGPT of a Chinese report from 42HOW. If you have any questions about it, please email bd@42how.com.
