Today we’ll discuss only one issue and present two graphs.
In yesterday’s article, we talked about the overall user experience of electric cars, and the issue of electric car energy consumption per 100 kilometers has recently begun to gain attention from readers, in addition to the most concerned electric car endurance indicator.
Energy consumption per 100 kilometers refers to how much electricity is used by an electric car to travel 100 kilometers.
There are two entry points here: one is how much money you need to spend to drive 100 kilometers, and the other is the difference in energy efficiency between different vehicles when running the same distance.
The relationship between efficiency and cost can be seen as efficiency determines cost.
In traditional internal combustion engine vehicles, we tend to focus only on cost and not efficiency, because there is a hidden attribute behind efficiency, which is convenience.
If energy acquisition is convenient enough, then you won’t pay attention to the correlation between energy efficiency and your life.
However, in the urgent boundary of electric car travel, electric car owners will find that, on the premise of the same battery capacity, the energy usage efficiency of the battery under different working conditions determines how far a vehicle can travel under different working conditions.
This determines the driving comfort of electric cars.
Now let’s move on to the graphs.
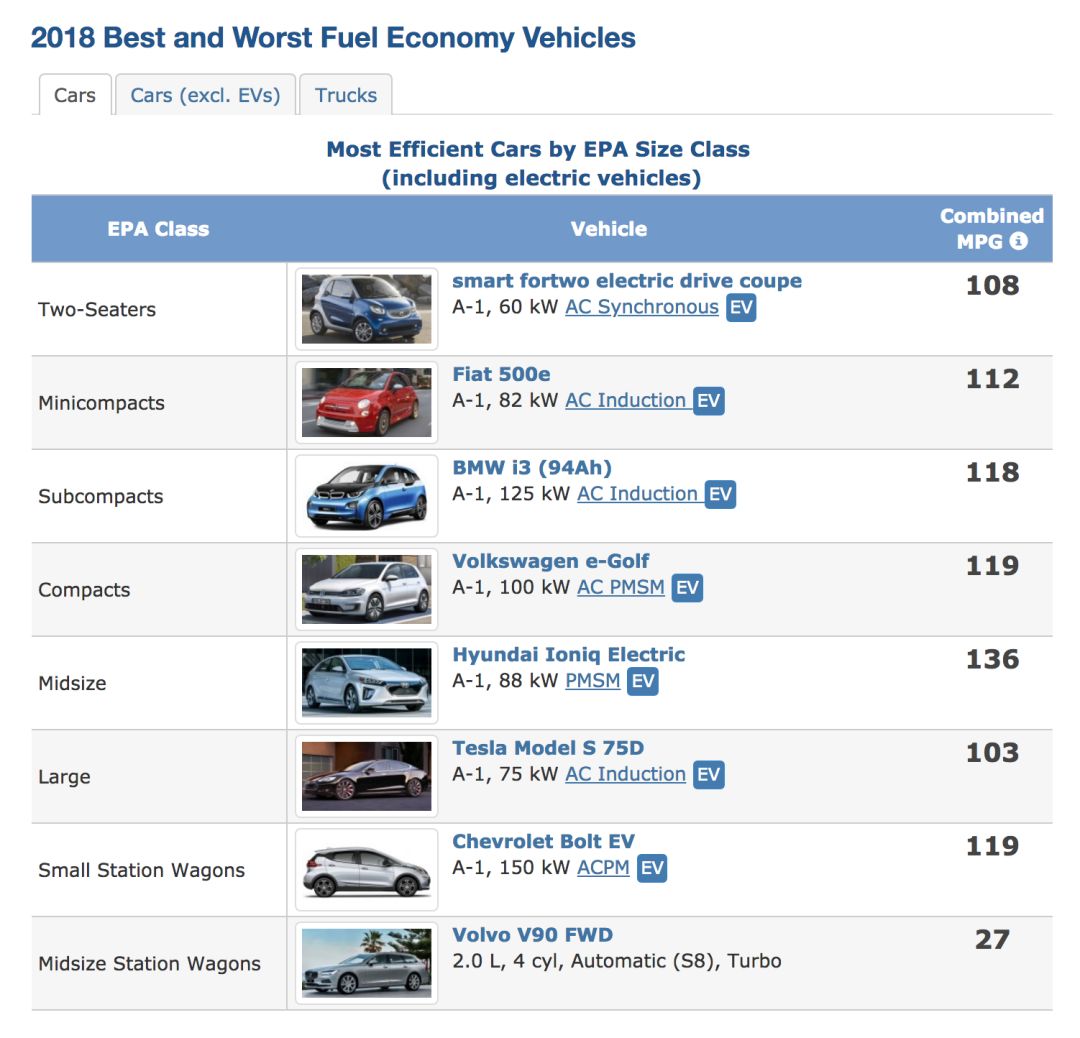
The first graph is from the US EPA statistics on the most energy-efficient models in each sub-segment market.

Except for the last column, the Volvo V90 ranks first (mainly because there are no other electric cars), and all other classification levels are dominated by pure electric cars.
Pure electric cars are undoubtedly the most energy-efficient.## About EPA’s Data Analysis
How to interpret EPA’s data? Yesterday we talked about it, and MPGe represents the miles per gallon of gasoline, equivalent to the miles driven per 33.7 degrees of electricity.
That is to say, the larger the data in the column on the right, the farther the vehicle can travel under the same battery energy.
Who has the largest data? It’s the modern Ioniq, with 136 MPGe.
In other words, in all vehicle submarkets, mid-size cars have the highest energy efficiency.
And in the large car market represented by the Model S, energy efficiency is the lowest utilized. The second to last is the two-seat car market represented by the Smart Fortwo.
The last column of fuel vehicle data “27” can be ignored.
It should be pointed out that because the US EPA data ranking list lacks data on domestic models, this does not represent the evaluation results of all global models.
The second graph also comes from the US EPA’s statistical data results.
Before looking at the picture, a risk warning should be made that because the US EPA uses the data reported by manufacturers under a unified standard, there may be errors in horizontal comparisons, such as some manufacturers have a history of false reporting.
But nevertheless, in the field of electric vehicle energy consumption testing, EPA has become a relatively reliable evaluation standard. In the absence of experience and evaluation data for electric vehicle use, it can serve as an important reference condition.
The following is the list of the energy consumption per 100 kilometers of pure electric vehicles from EPA’s statistics over the years.

Note: The urban working condition in the figure refers to the situation where the maximum speed is 90 kilometers per hour and the average speed is 34 kilometers per hour. The high-speed working condition refers to the situation where the maximum speed is 97 kilometers per hour and the average speed is 78 kilometers per hour.
The picture is the main point, and a few simple explanations should be made:1. As mentioned earlier, the champion is the Hyundai Ioniq in the hybrid condition, with an electric consumption of 15.5 kWh per 100 km.
- Without considering the model year, the runner-up is the Tesla Model 3 in the hybrid condition, with an electric consumption of 16.2 kWh per 100 km. Additionally, if we only consider the highway condition, the Tesla Model 3 has the lowest electric consumption per 100 km, currently at 17.1 kWh.
- An amazing feature of Tesla is that the electric consumption per 100 km is equivalent between the highway and city conditions, even better in the highway condition. From the high energy consumption and long-range setting, it can be seen that Tesla is actively making efforts for the long-distance use of electric vehicles.
- Among Tesla models, the Model 3 has the best electric consumption performance. Among Model S/X models, the electric consumption of the Model S is lower than that of the Model X. Among Model S cars, the lowest electric consumption is the 2017 Model S 90D. Among Model X cars, the lowest electric consumption is the Model X 75D.
- Tesla models with “P” consume more electricity. The Tesla Model X P100D has an excellent performance on the highway: only 22.9 kWh per 100 km.
- Some cars become more energy-efficient after modification, such as the BMW i3, Volkswagen e-Golf, and Smart Fortwo. Some cars become more energy-consuming after modification, such as the Nissan Leaf.
Why do we have such results?
We’ll talk about it next time 🙂


This article is a translation by ChatGPT of a Chinese report from 42HOW. If you have any questions about it, please email bd@42how.com.
